Discover the best spots
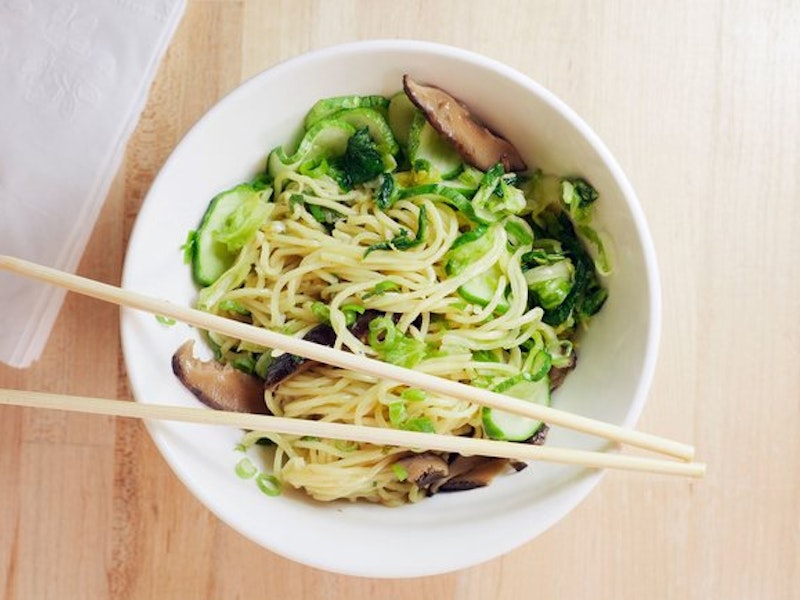
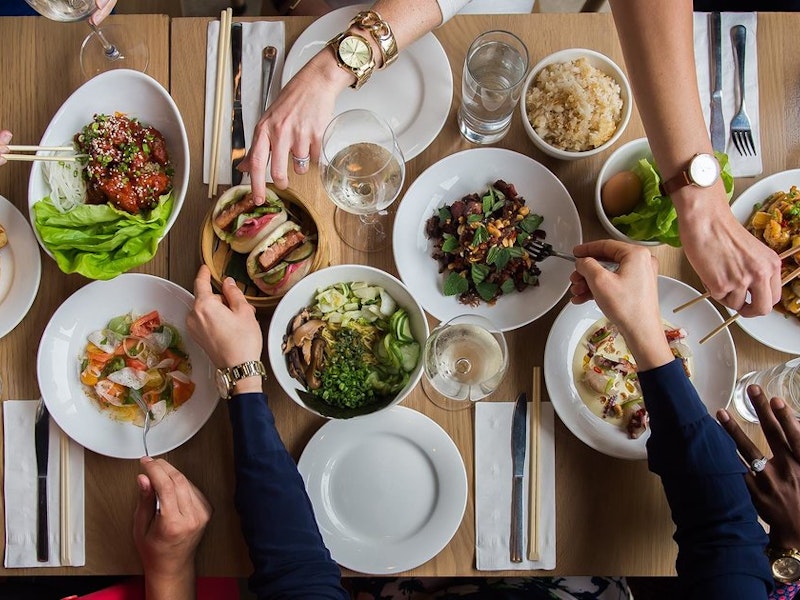
Momofuku Noodle Bar
Korean, Chinese, Ramen, Asian • New York, New York
27 EXPERT REVIEWS
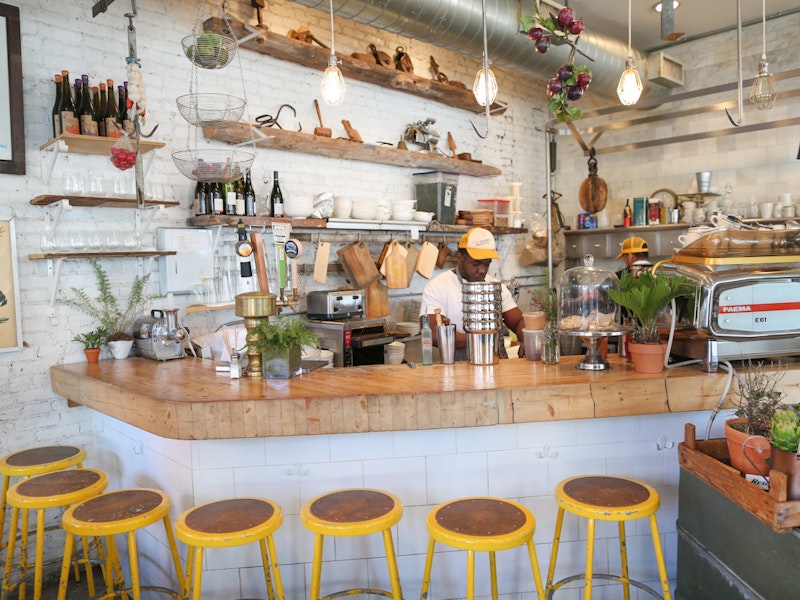
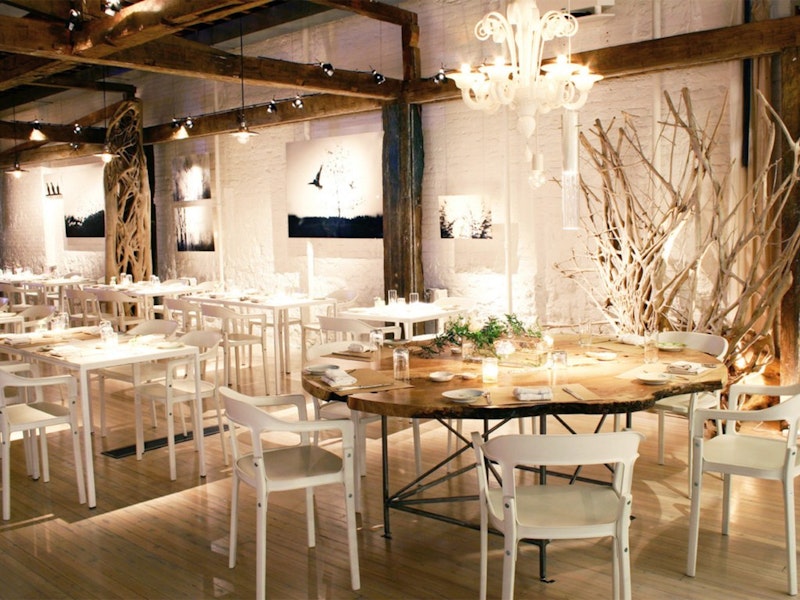
The Butcher's Daughter
Vegetarian & Vegan, Bistros & Cafés, Juices & Smoothies • New York, New York
16 EXPERT REVIEWS

Balthazar
French • New York, New York
27 EXPERT REVIEWS
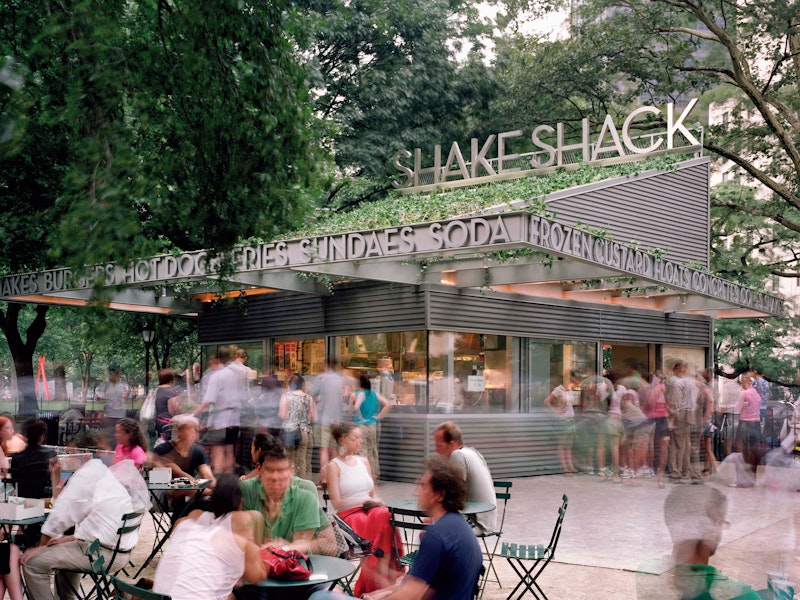
Shake Shack
Ice Cream, Burgers • New York, New York
21 EXPERT REVIEWS
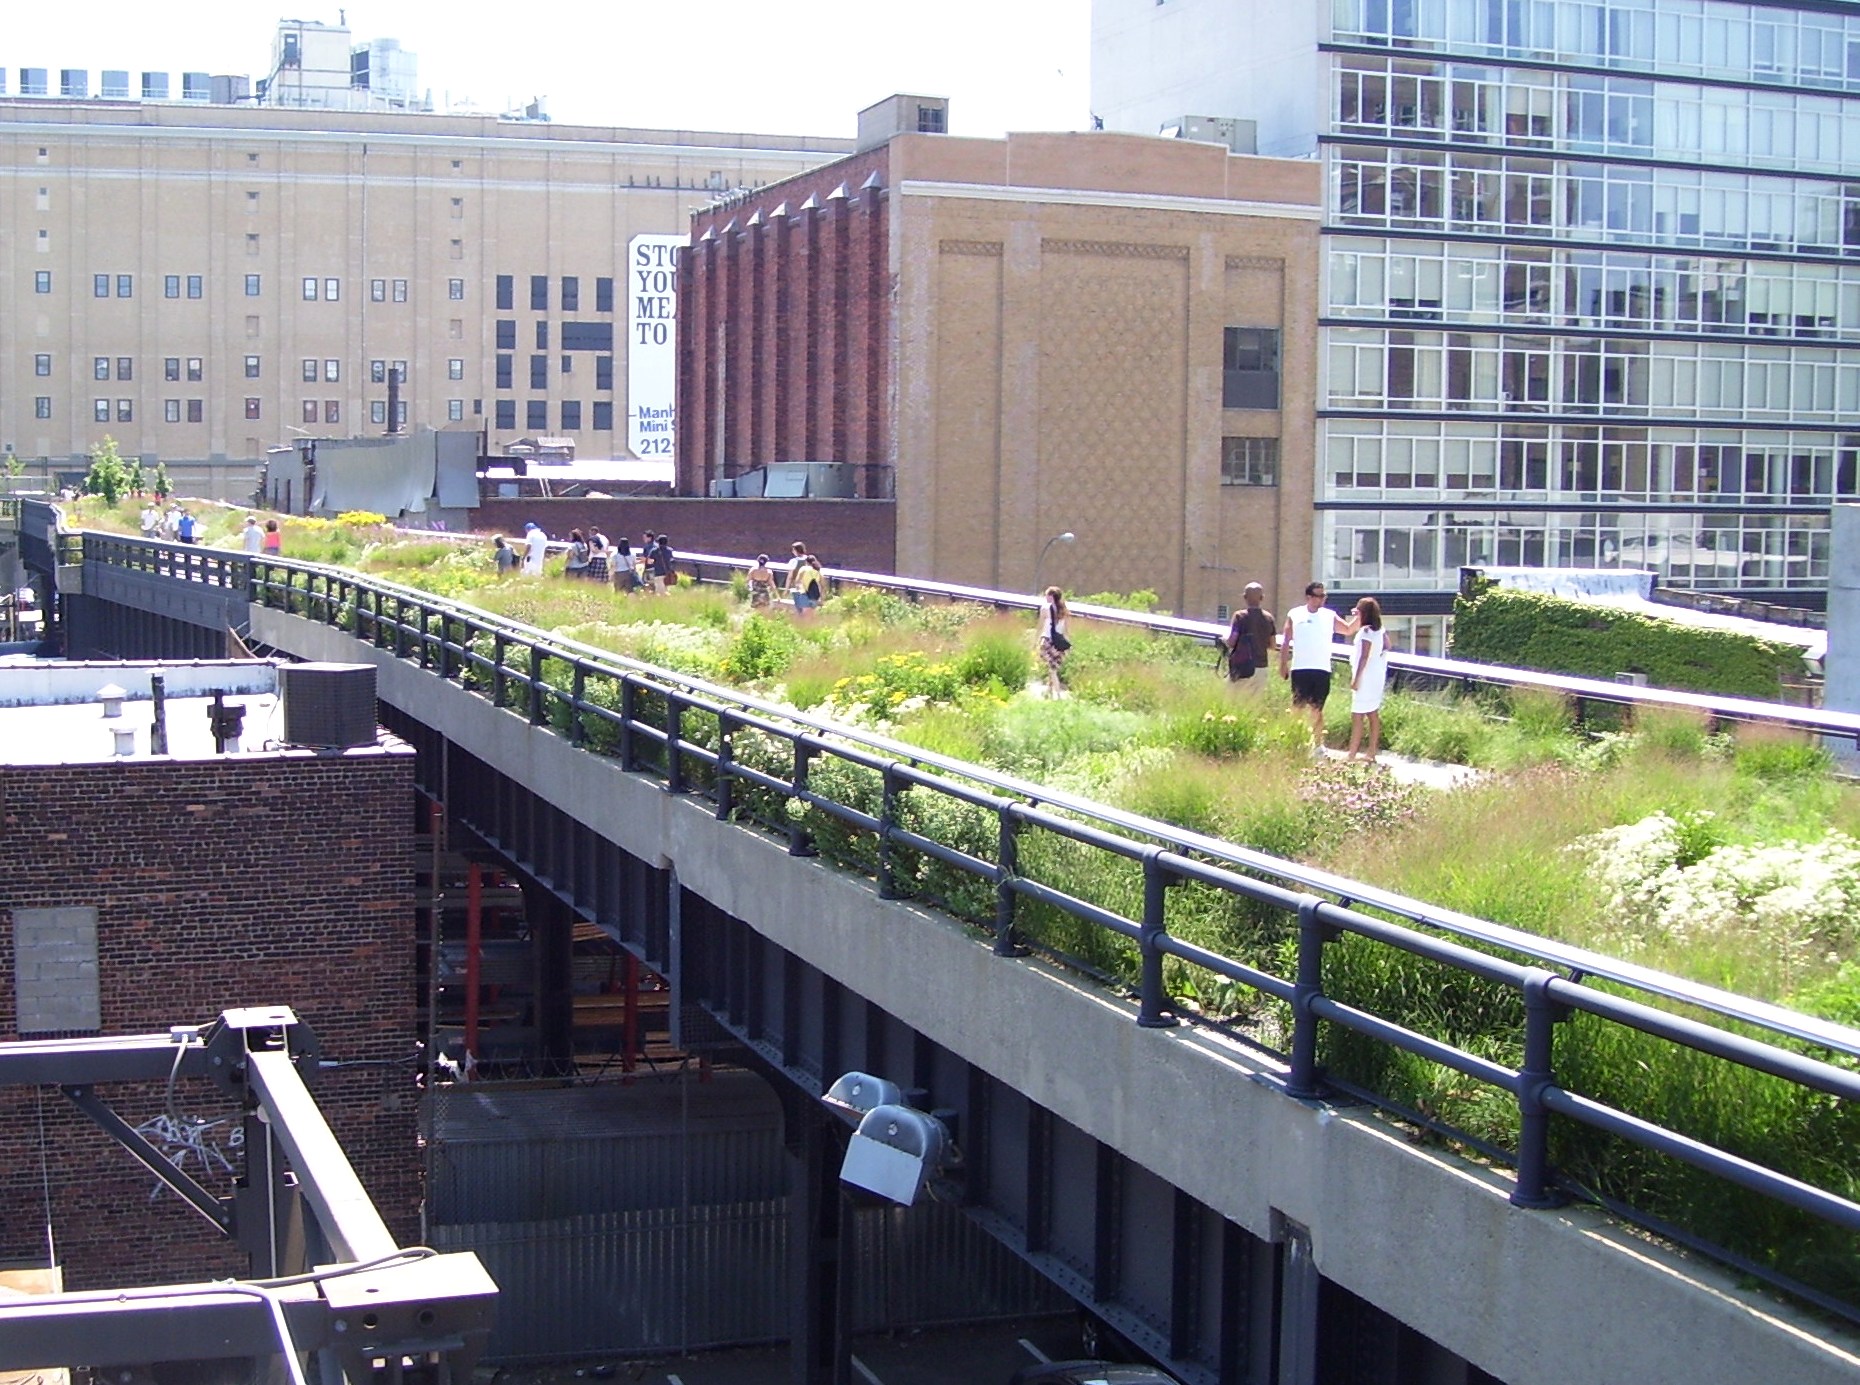
The High Line
Elevated Park • New York, New York
1789 EXPERT REVIEWS
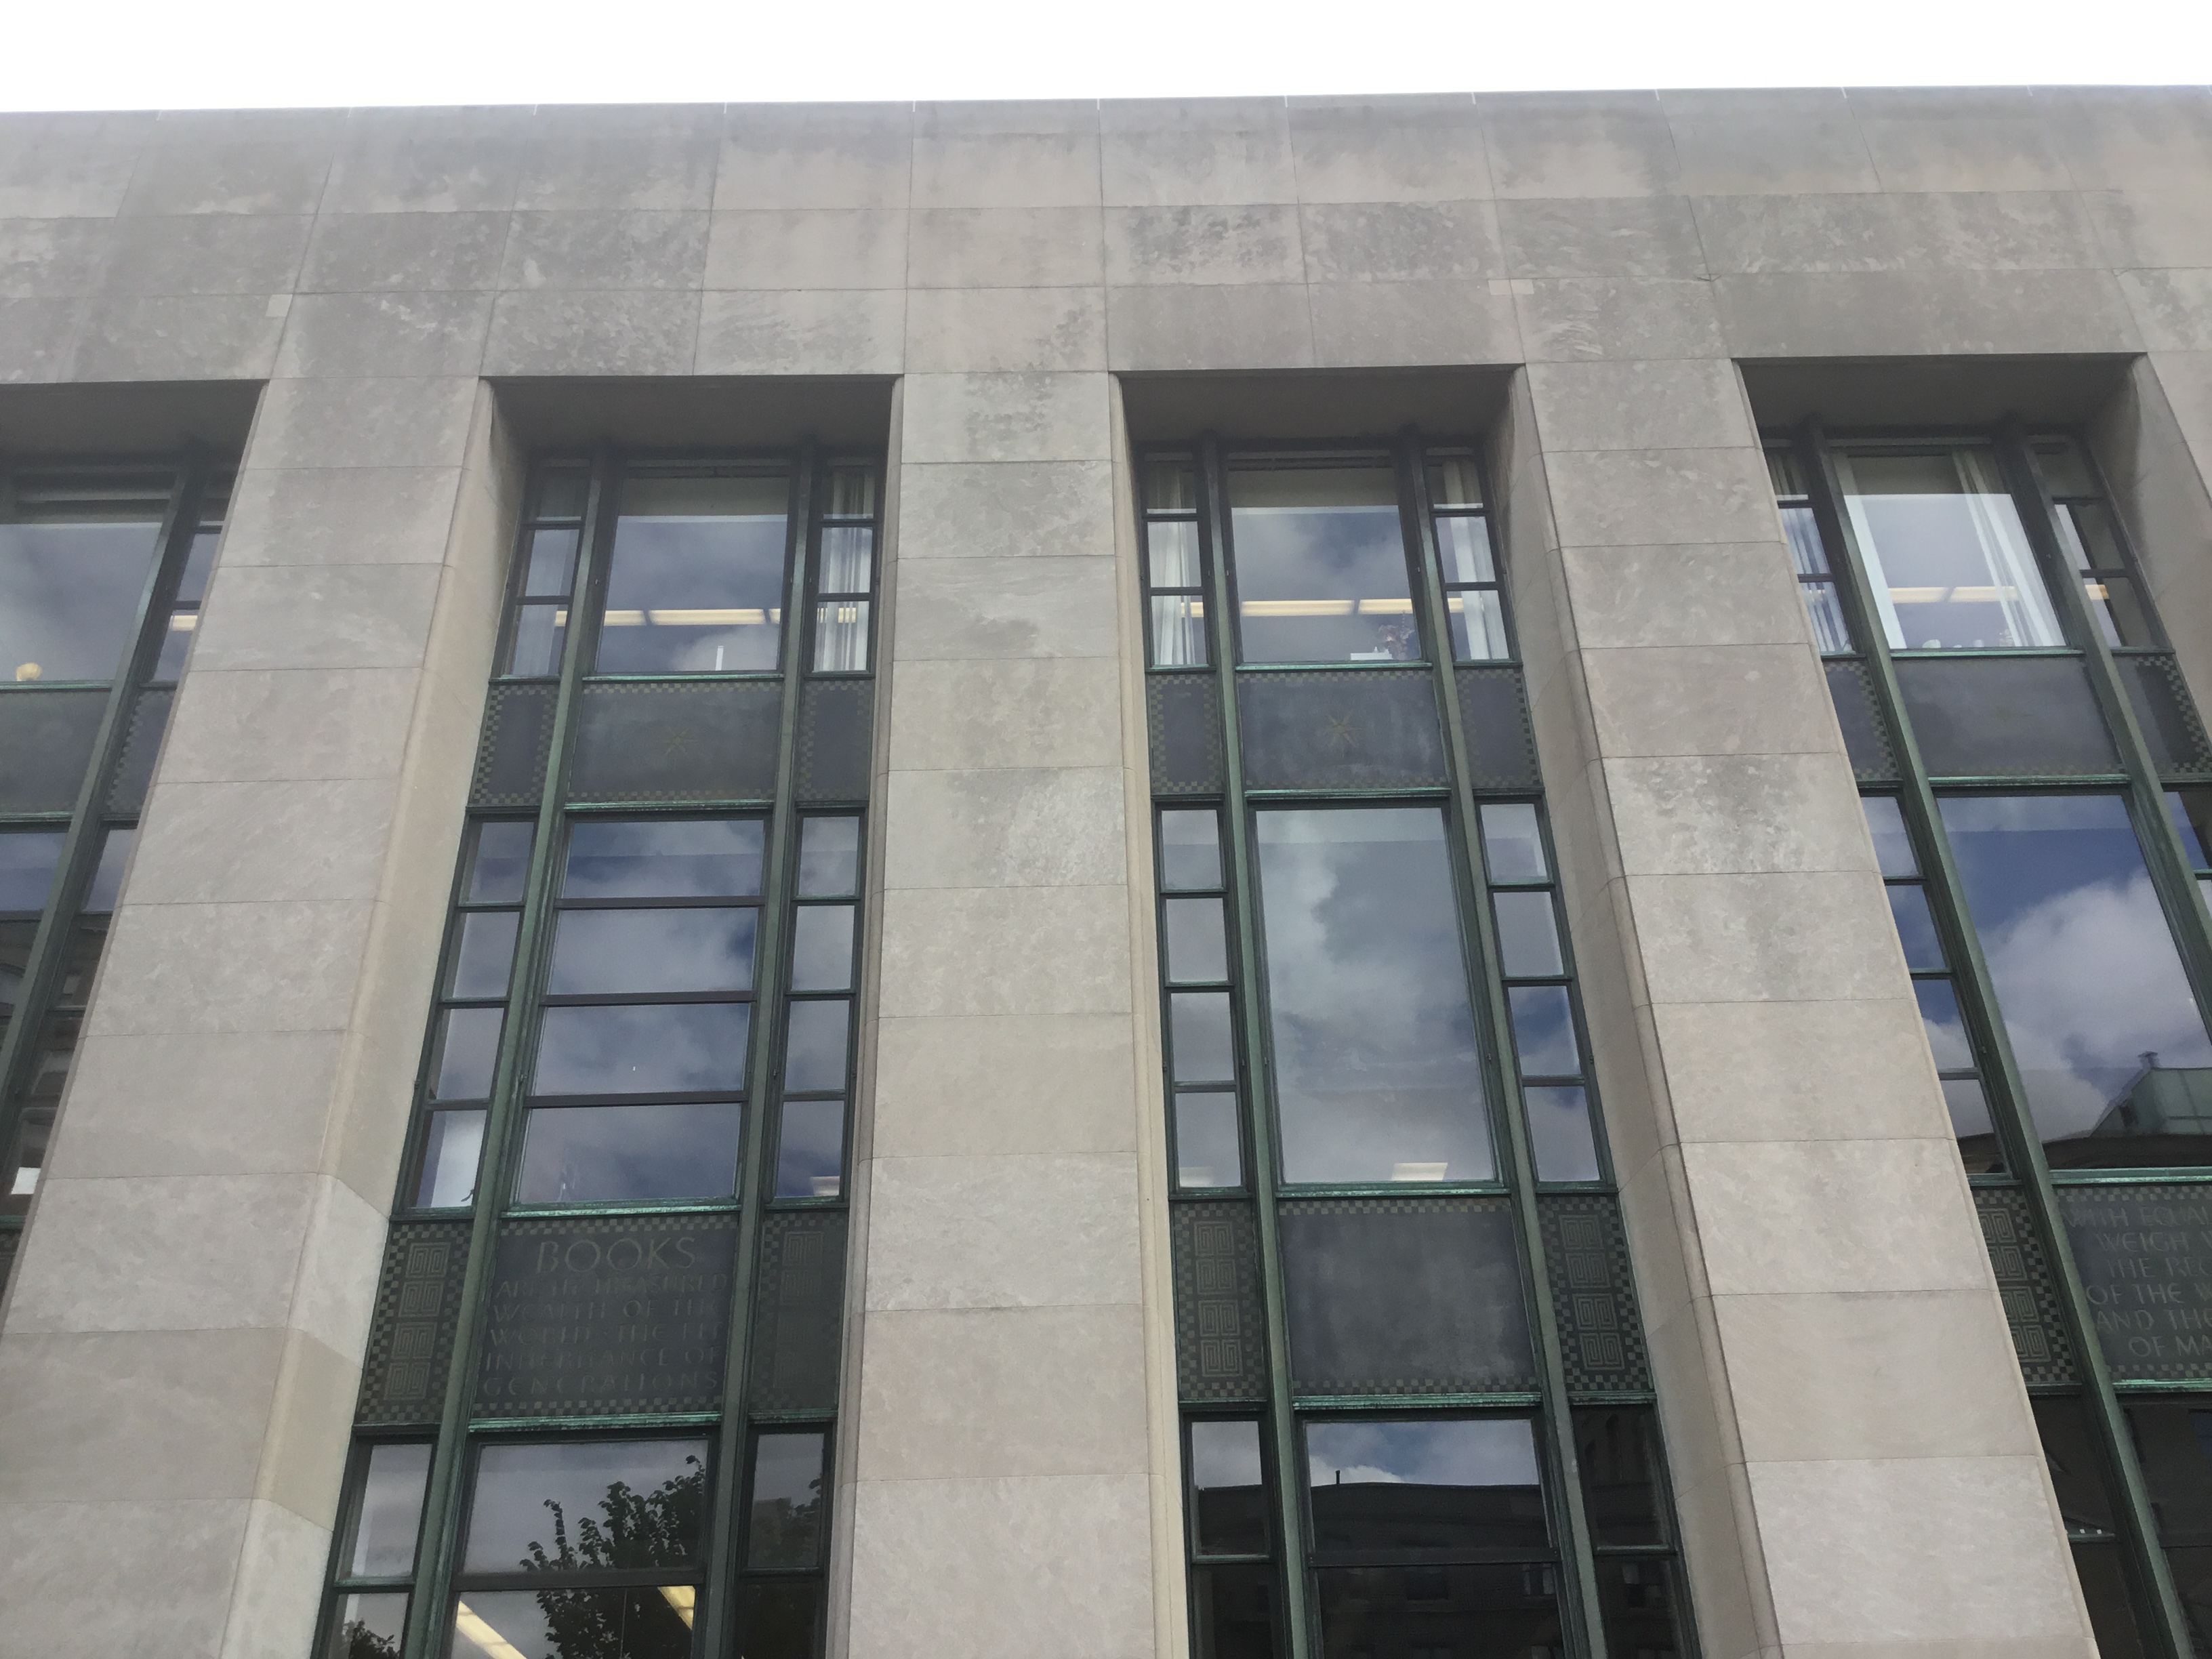
Brooklyn Public Library
Library • Brooklyn, New York
1234 EXPERT REVIEWS
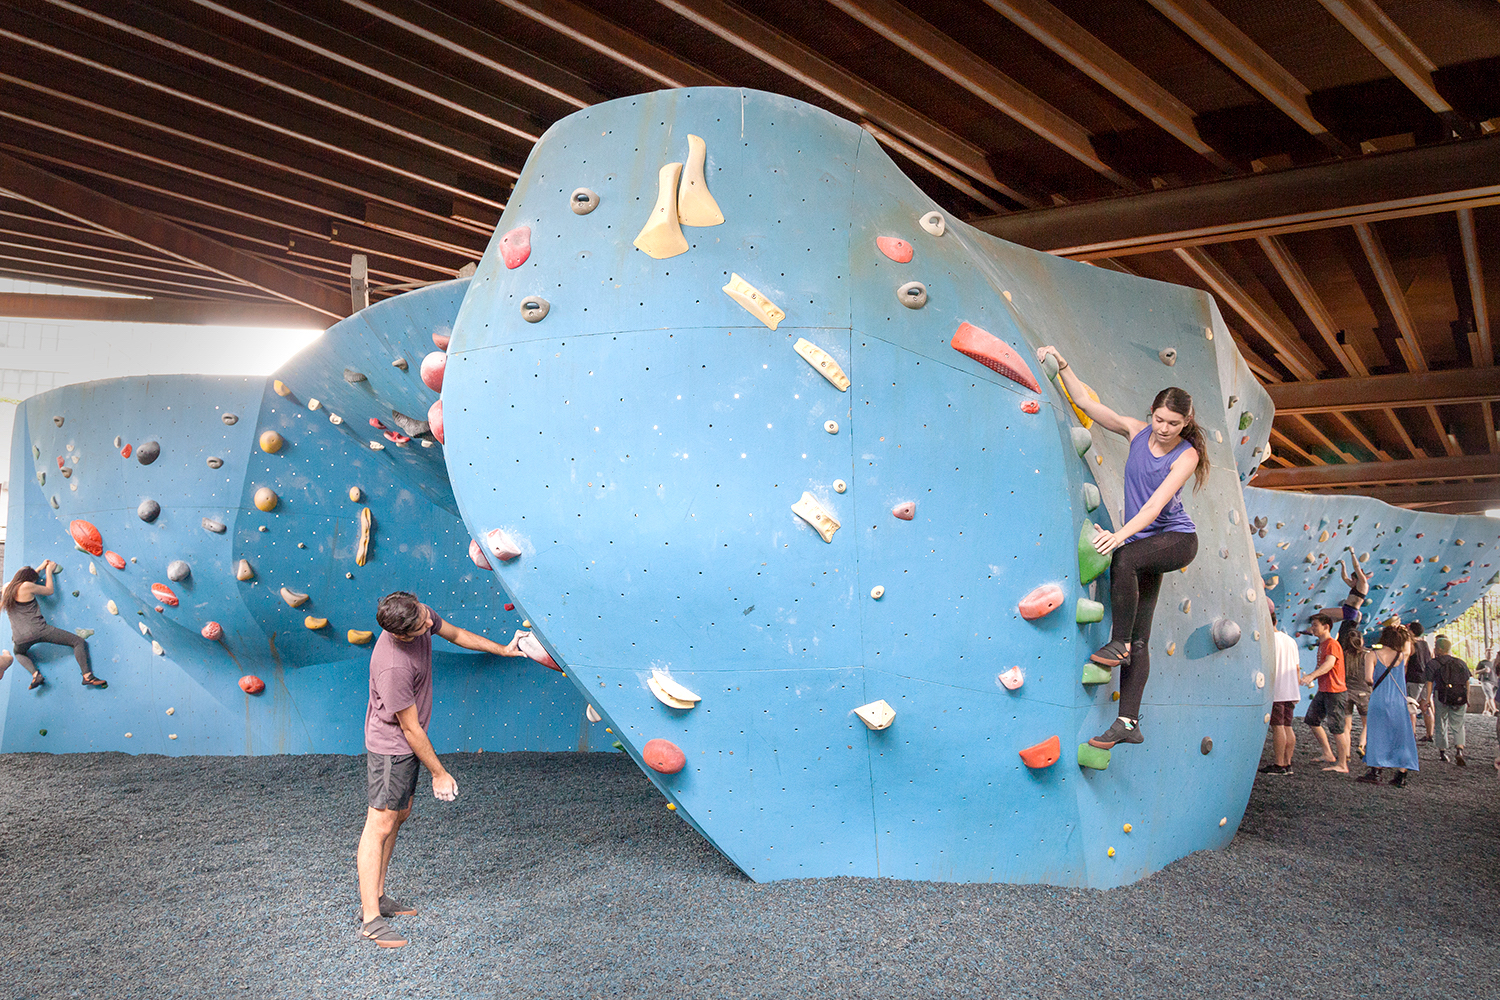
Brooklyn Boulders
Climbing Gym • Brooklyn, New York
1234 EXPERT REVIEWS
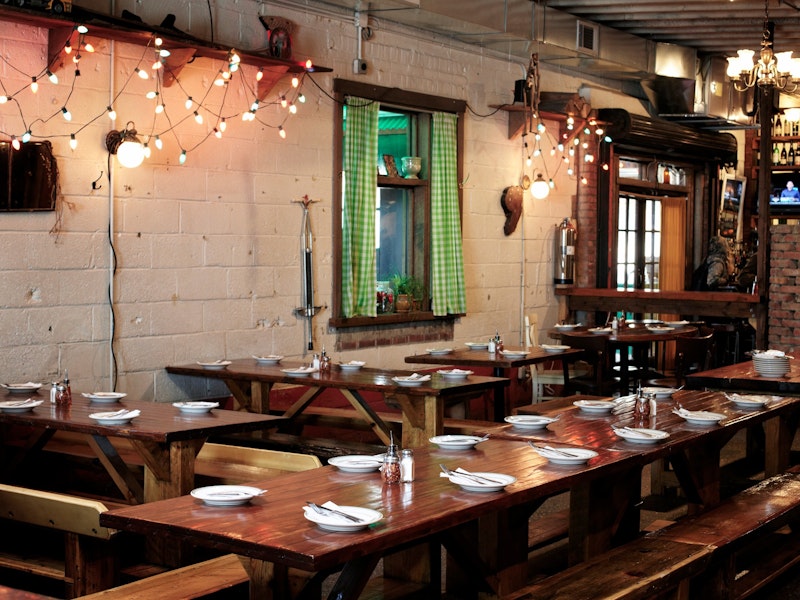
Roberta's
Pizza • New York, New York
27 EXPERT REVIEWS
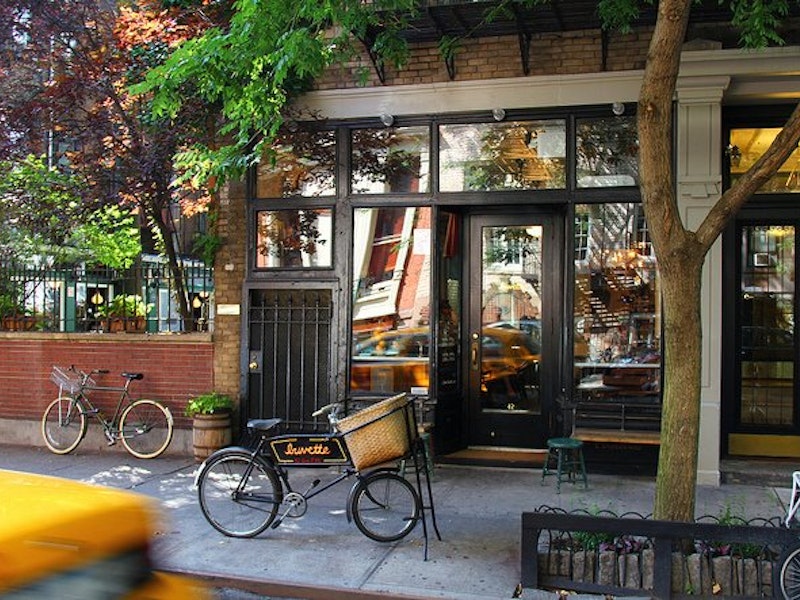
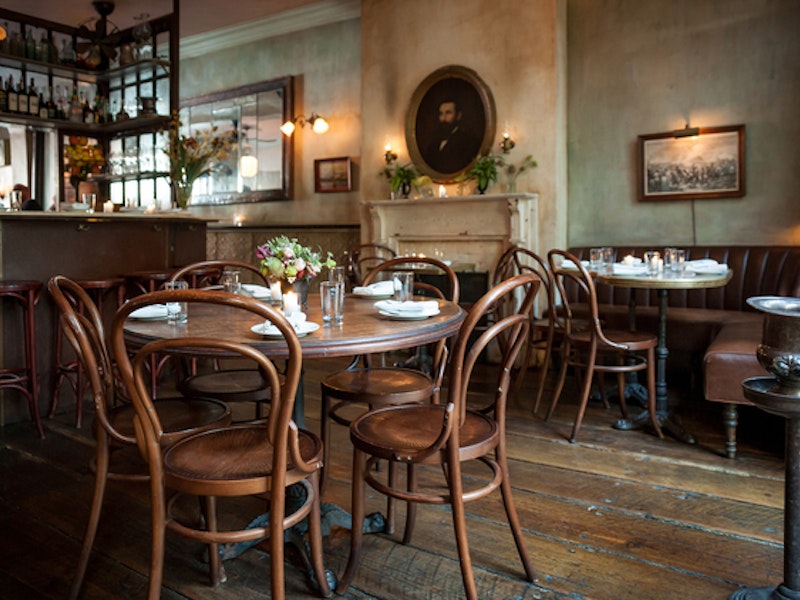
Buvette
Breakfast, French • New York, New York
21 EXPERT REVIEWS
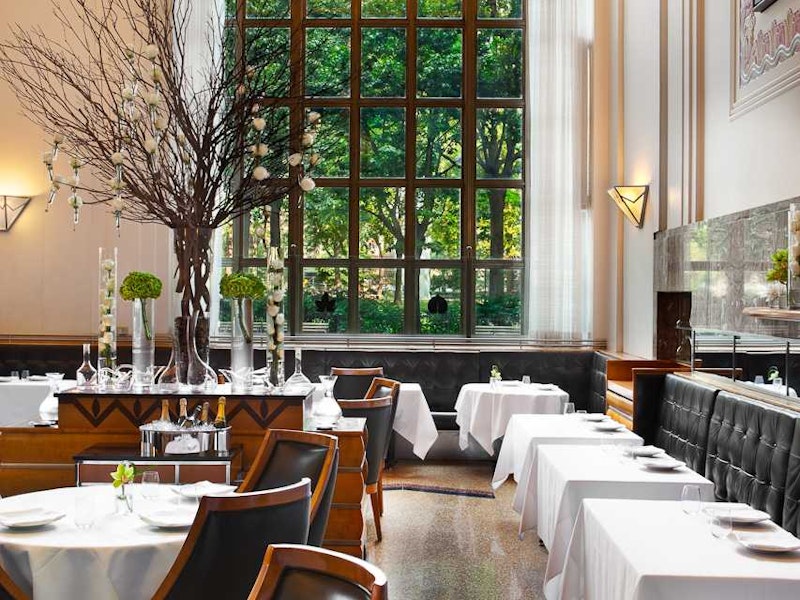
Eleven Madison Park
New American, American • New York, New York
35 EXPERT REVIEWS
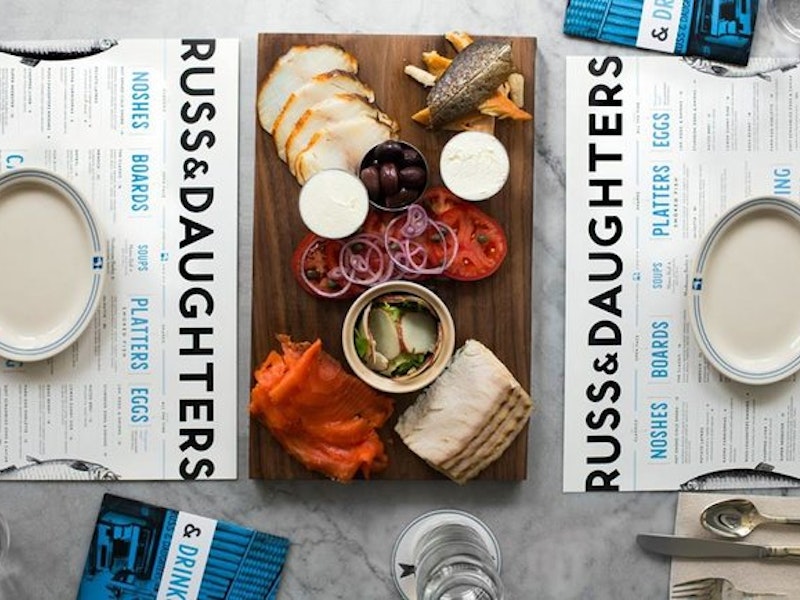
Russ & Daughters
Breakfast, Bistros & Cafés, Specialty • New York, New York
16 EXPERT REVIEWS
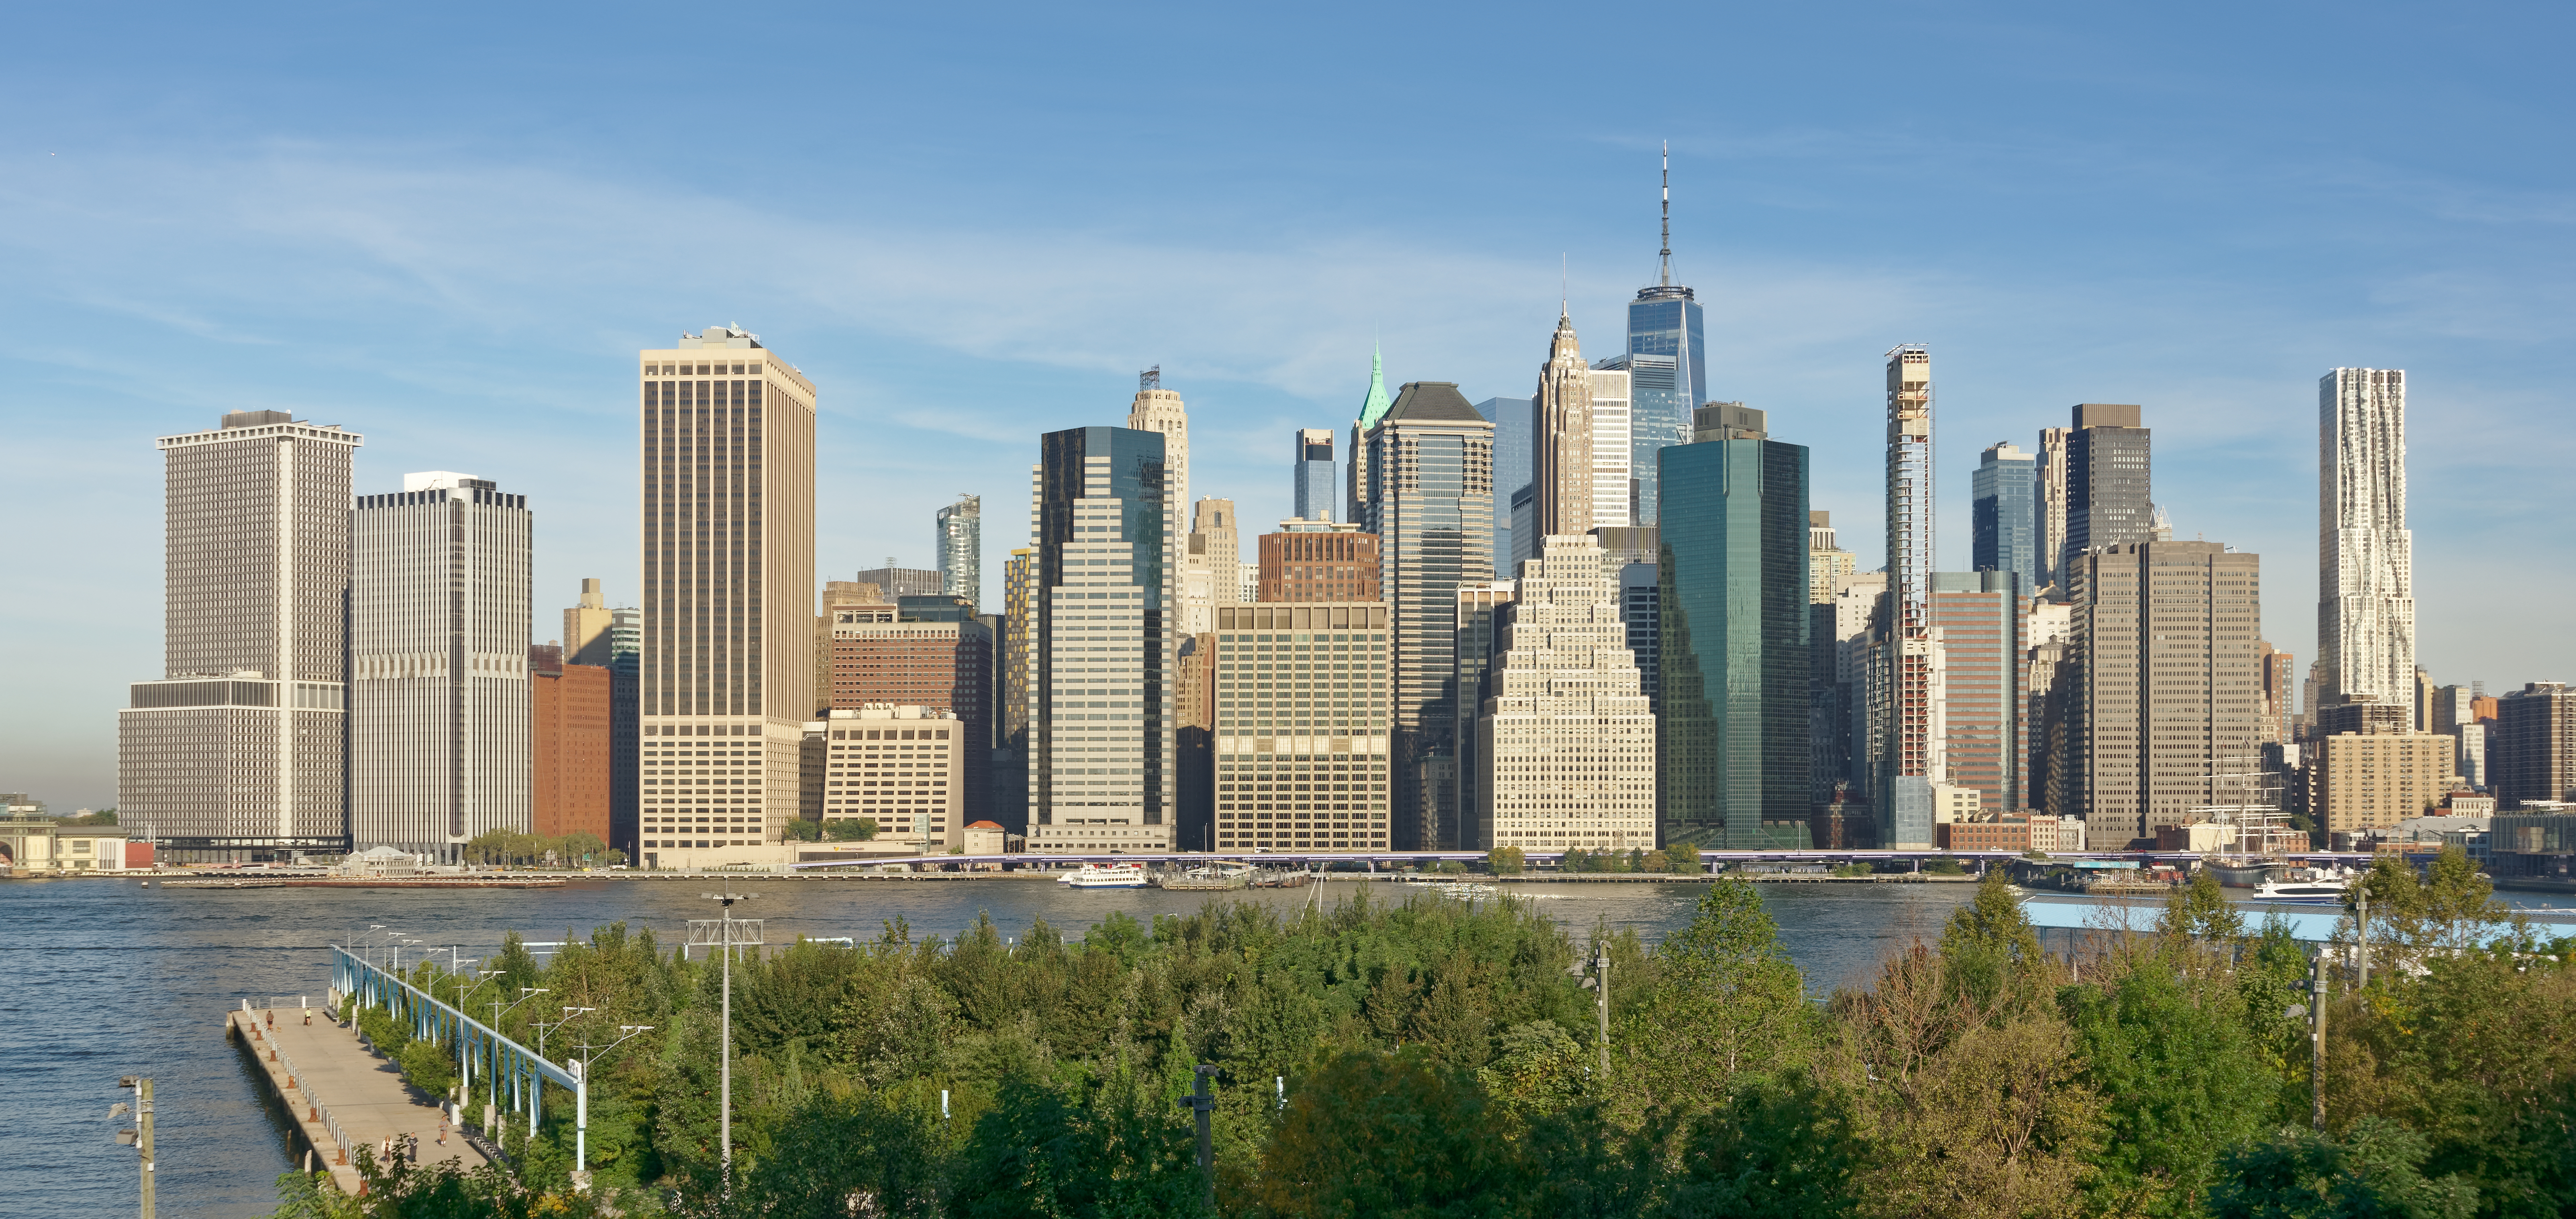
Brooklyn Bridge Park
Waterfront Park • Brooklyn, New York
1345 EXPERT REVIEWS
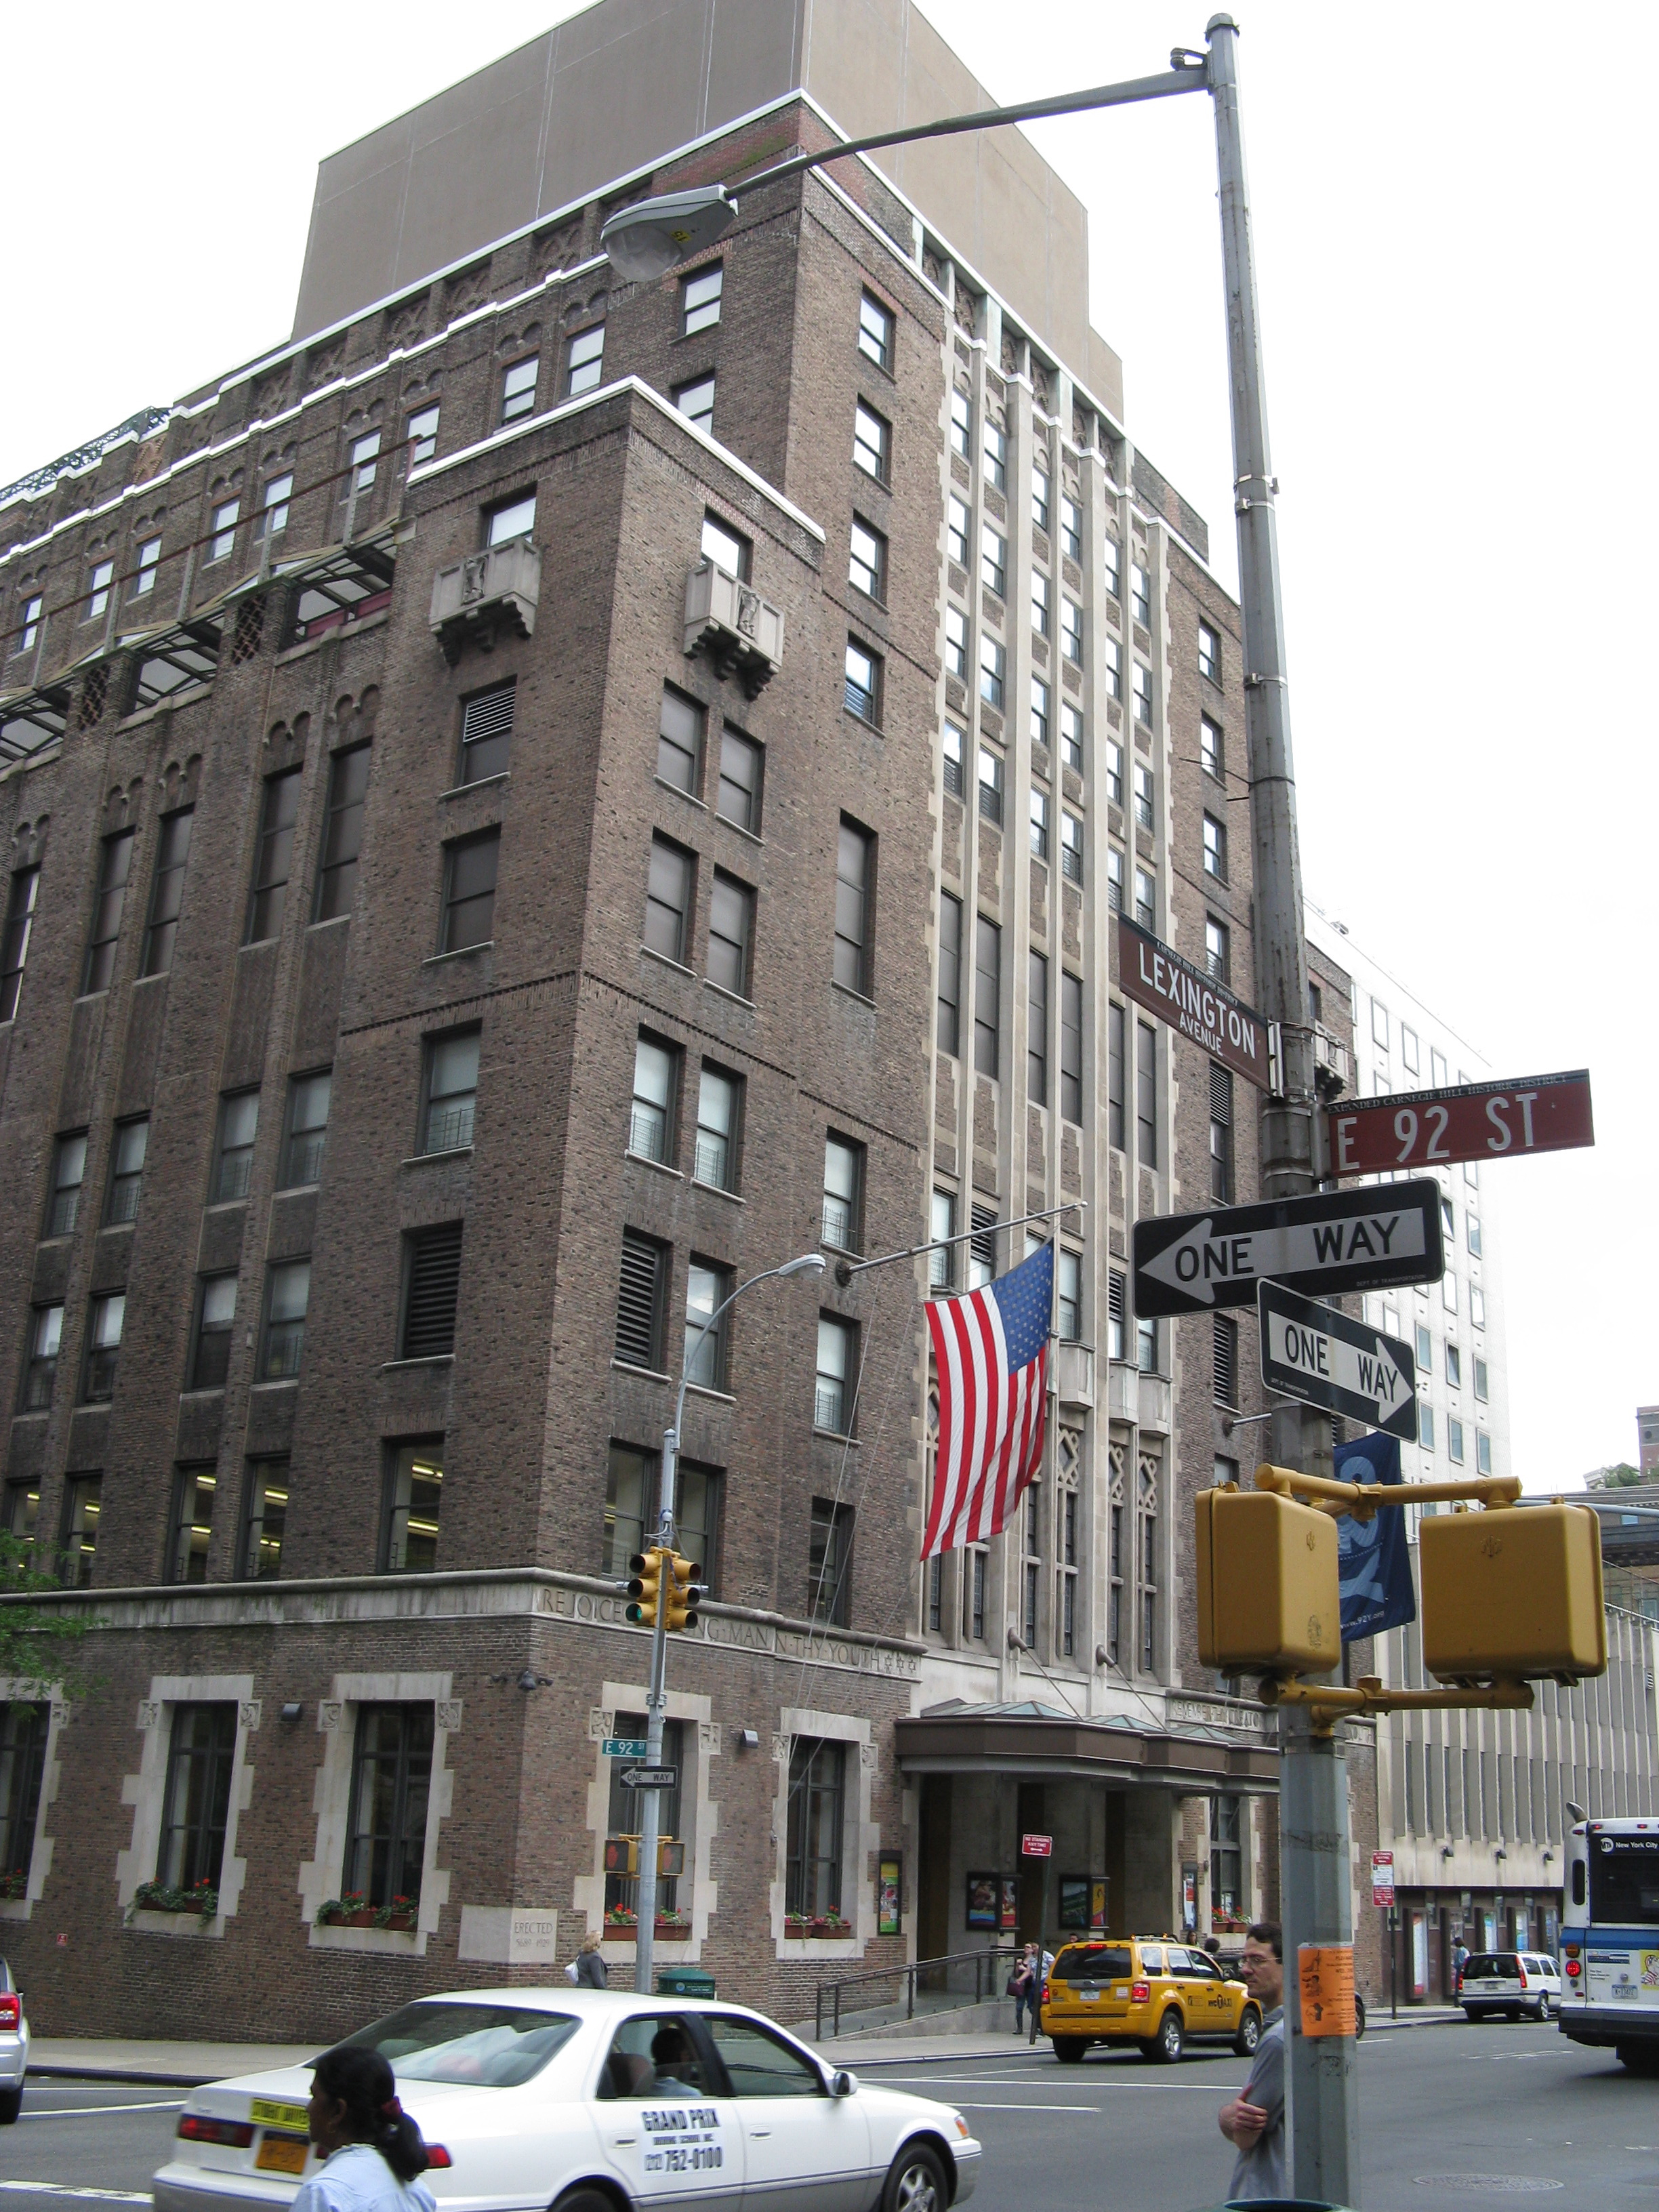
92nd Street Y
Community Center • New York, New York
876 EXPERT REVIEWS
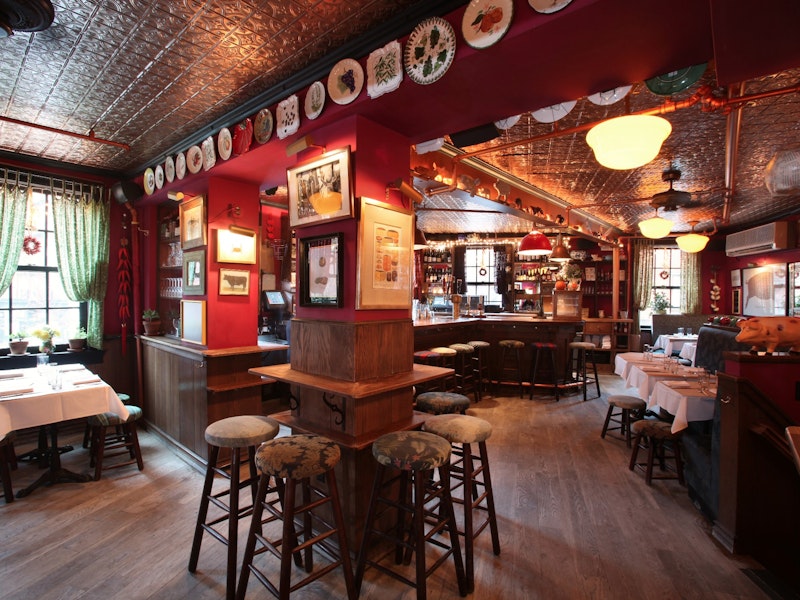
The Spotted Pig
Gastropub • New York, New York
32 EXPERT REVIEWS
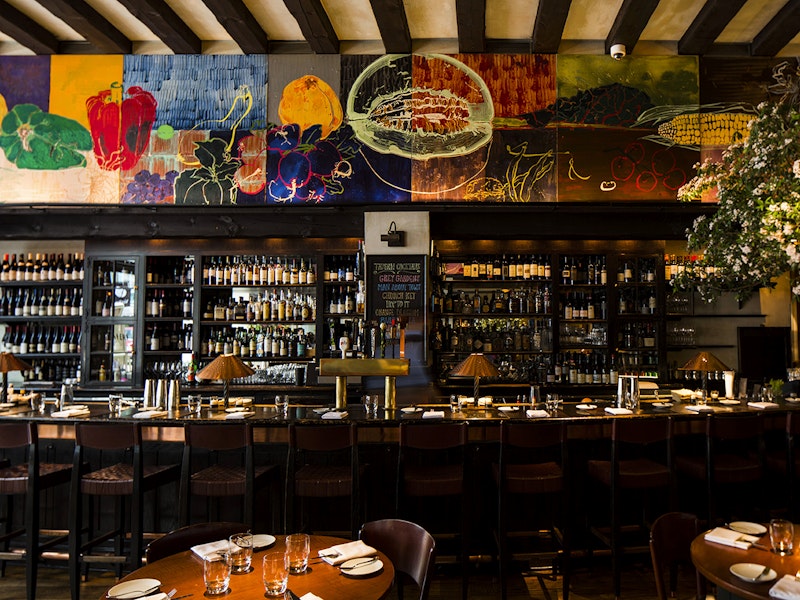
Gramercy Tavern
Bar, American • New York, New York
29 EXPERT REVIEWS
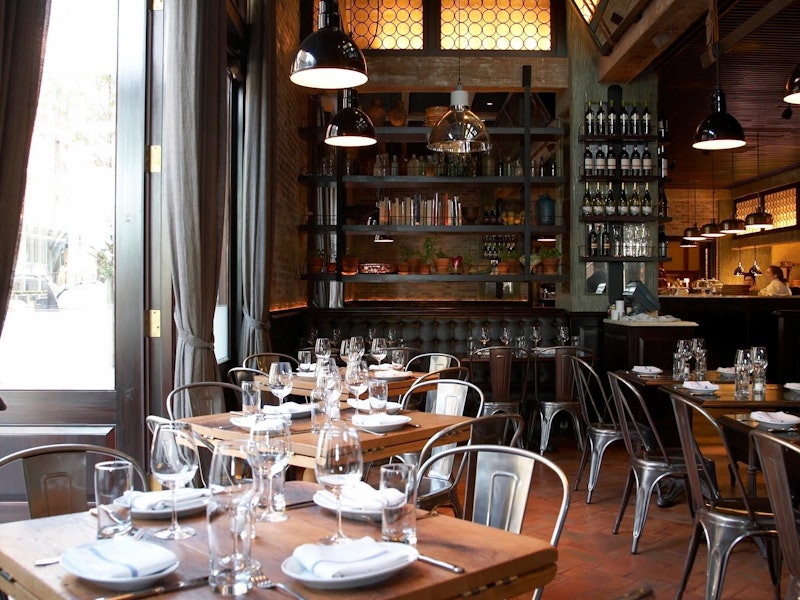
Locanda Verde
Lounge, Italian, Wine Bar • New York, New York
29 EXPERT REVIEWS
Maison Premiere
Seafood, Cocktail Bar • New York, New York
31 EXPERT REVIEWS
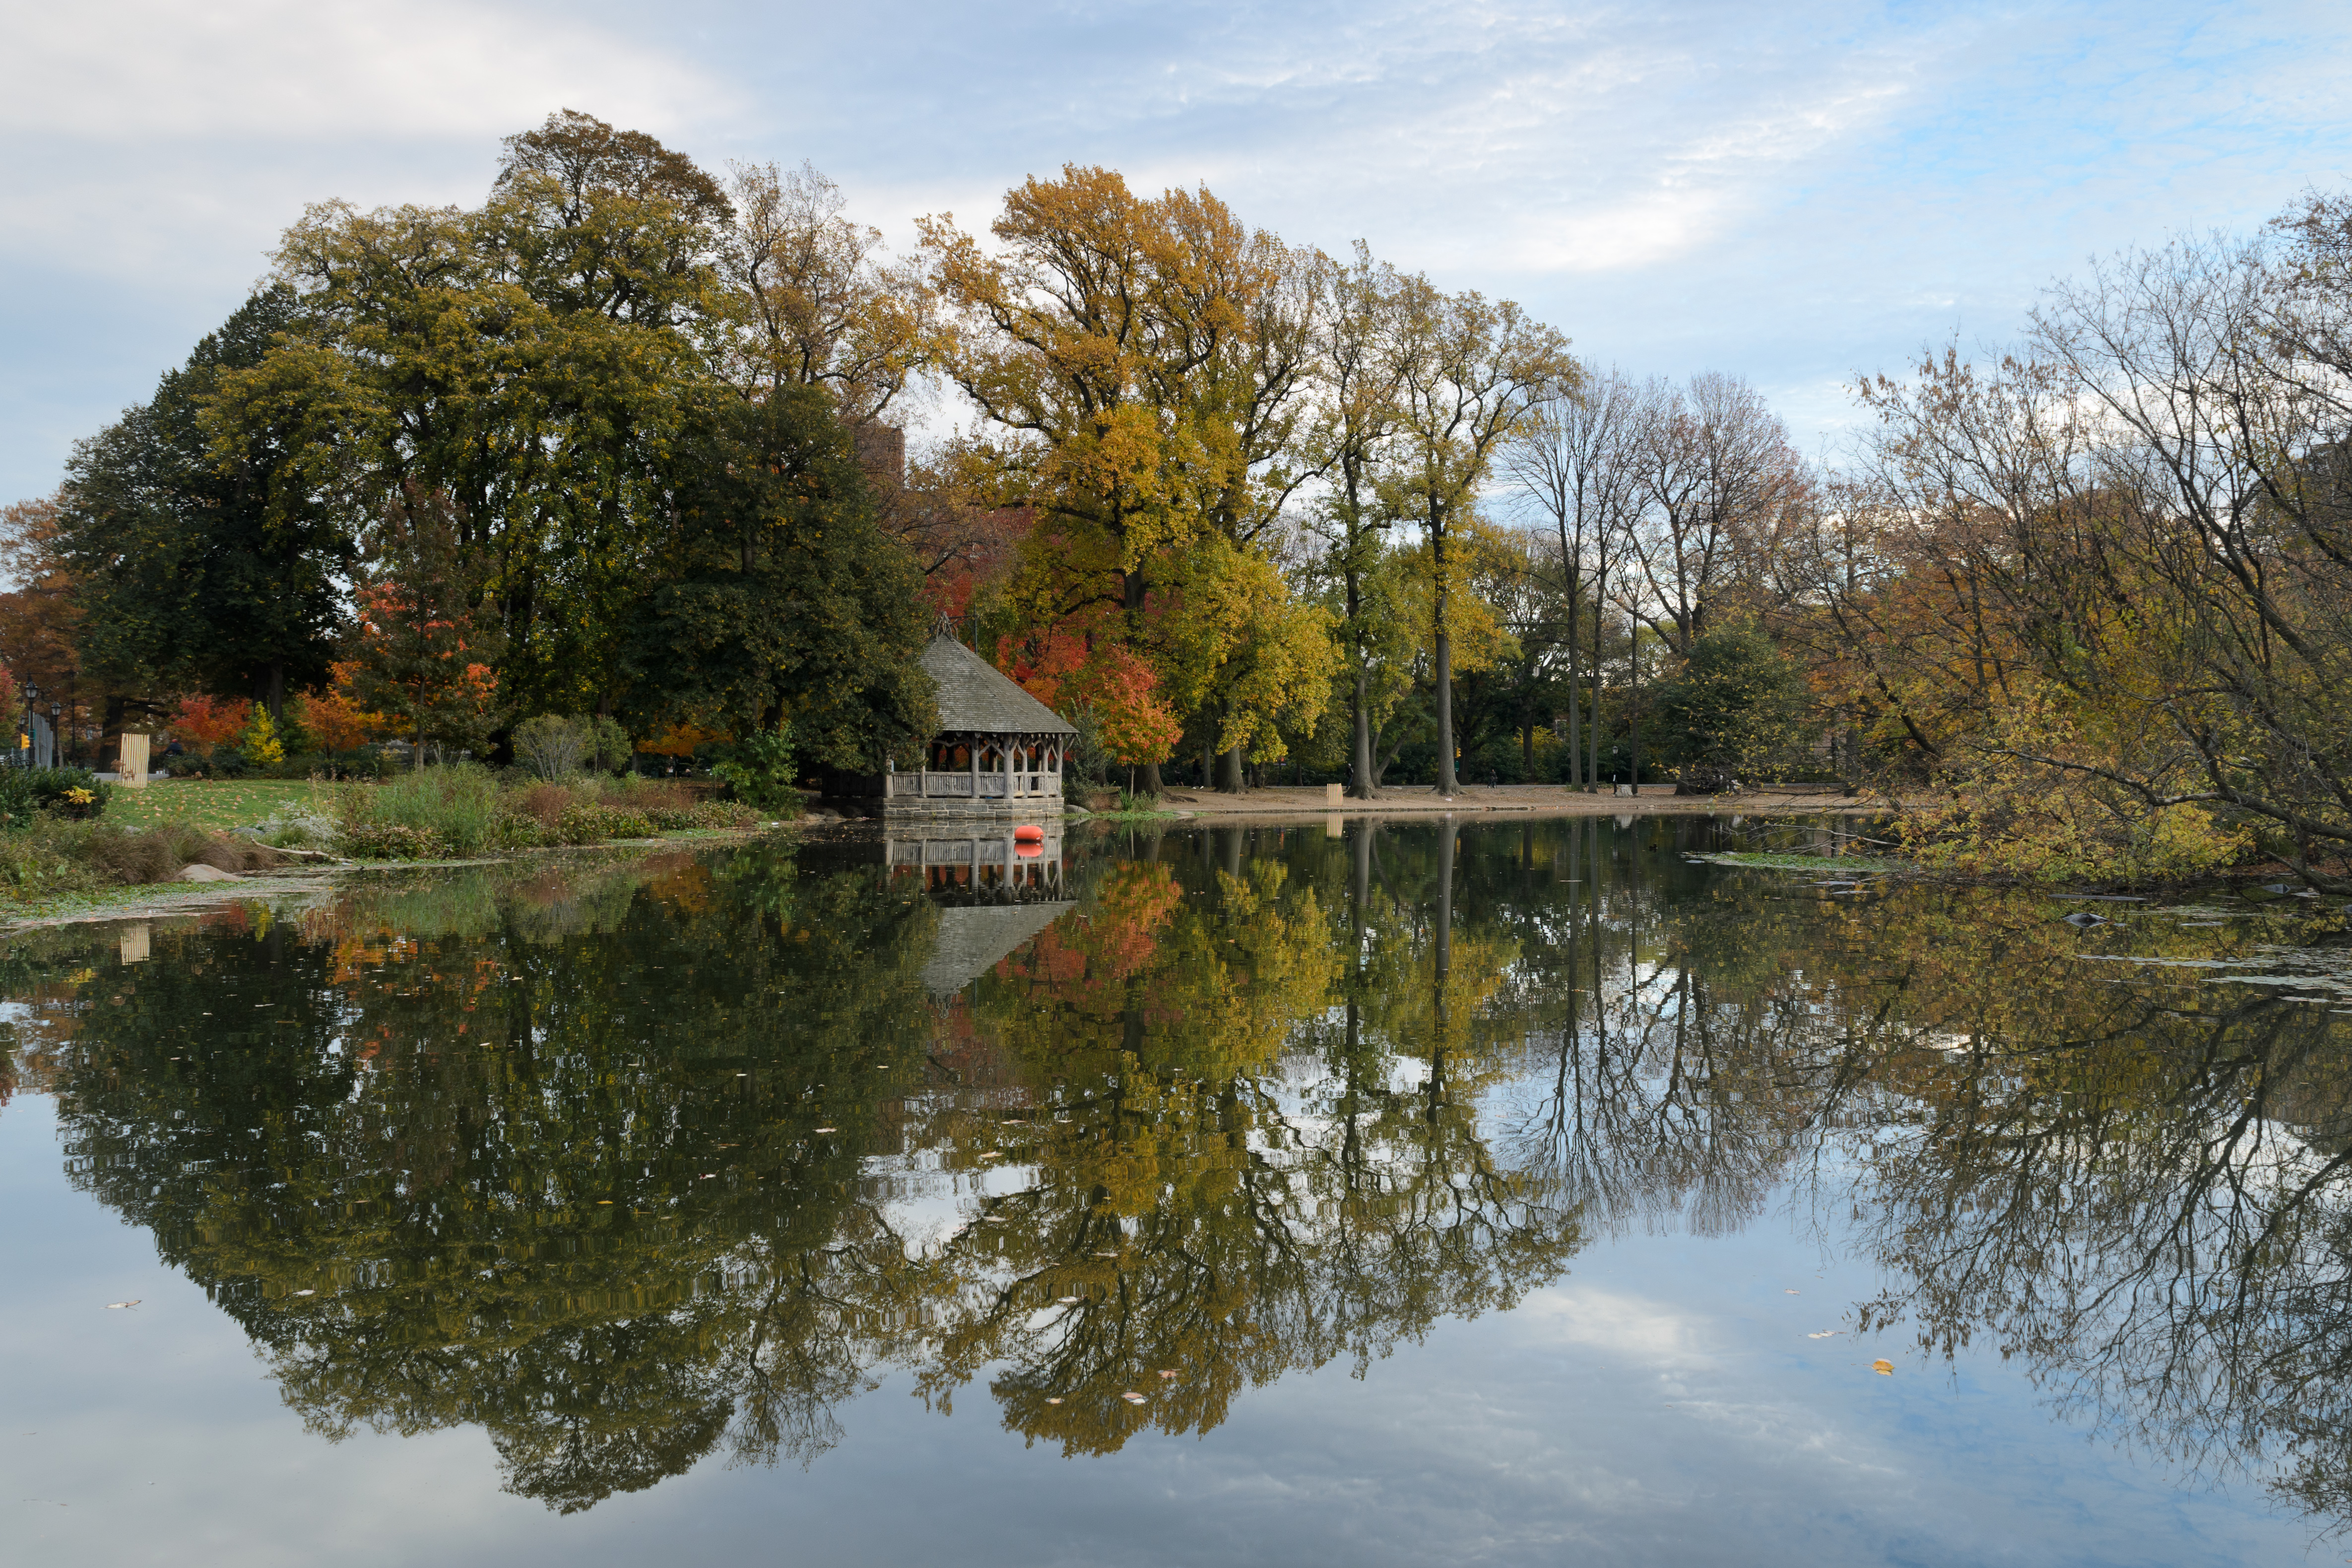
Prospect Park
Urban Park • Brooklyn, New York
987 EXPERT REVIEWS
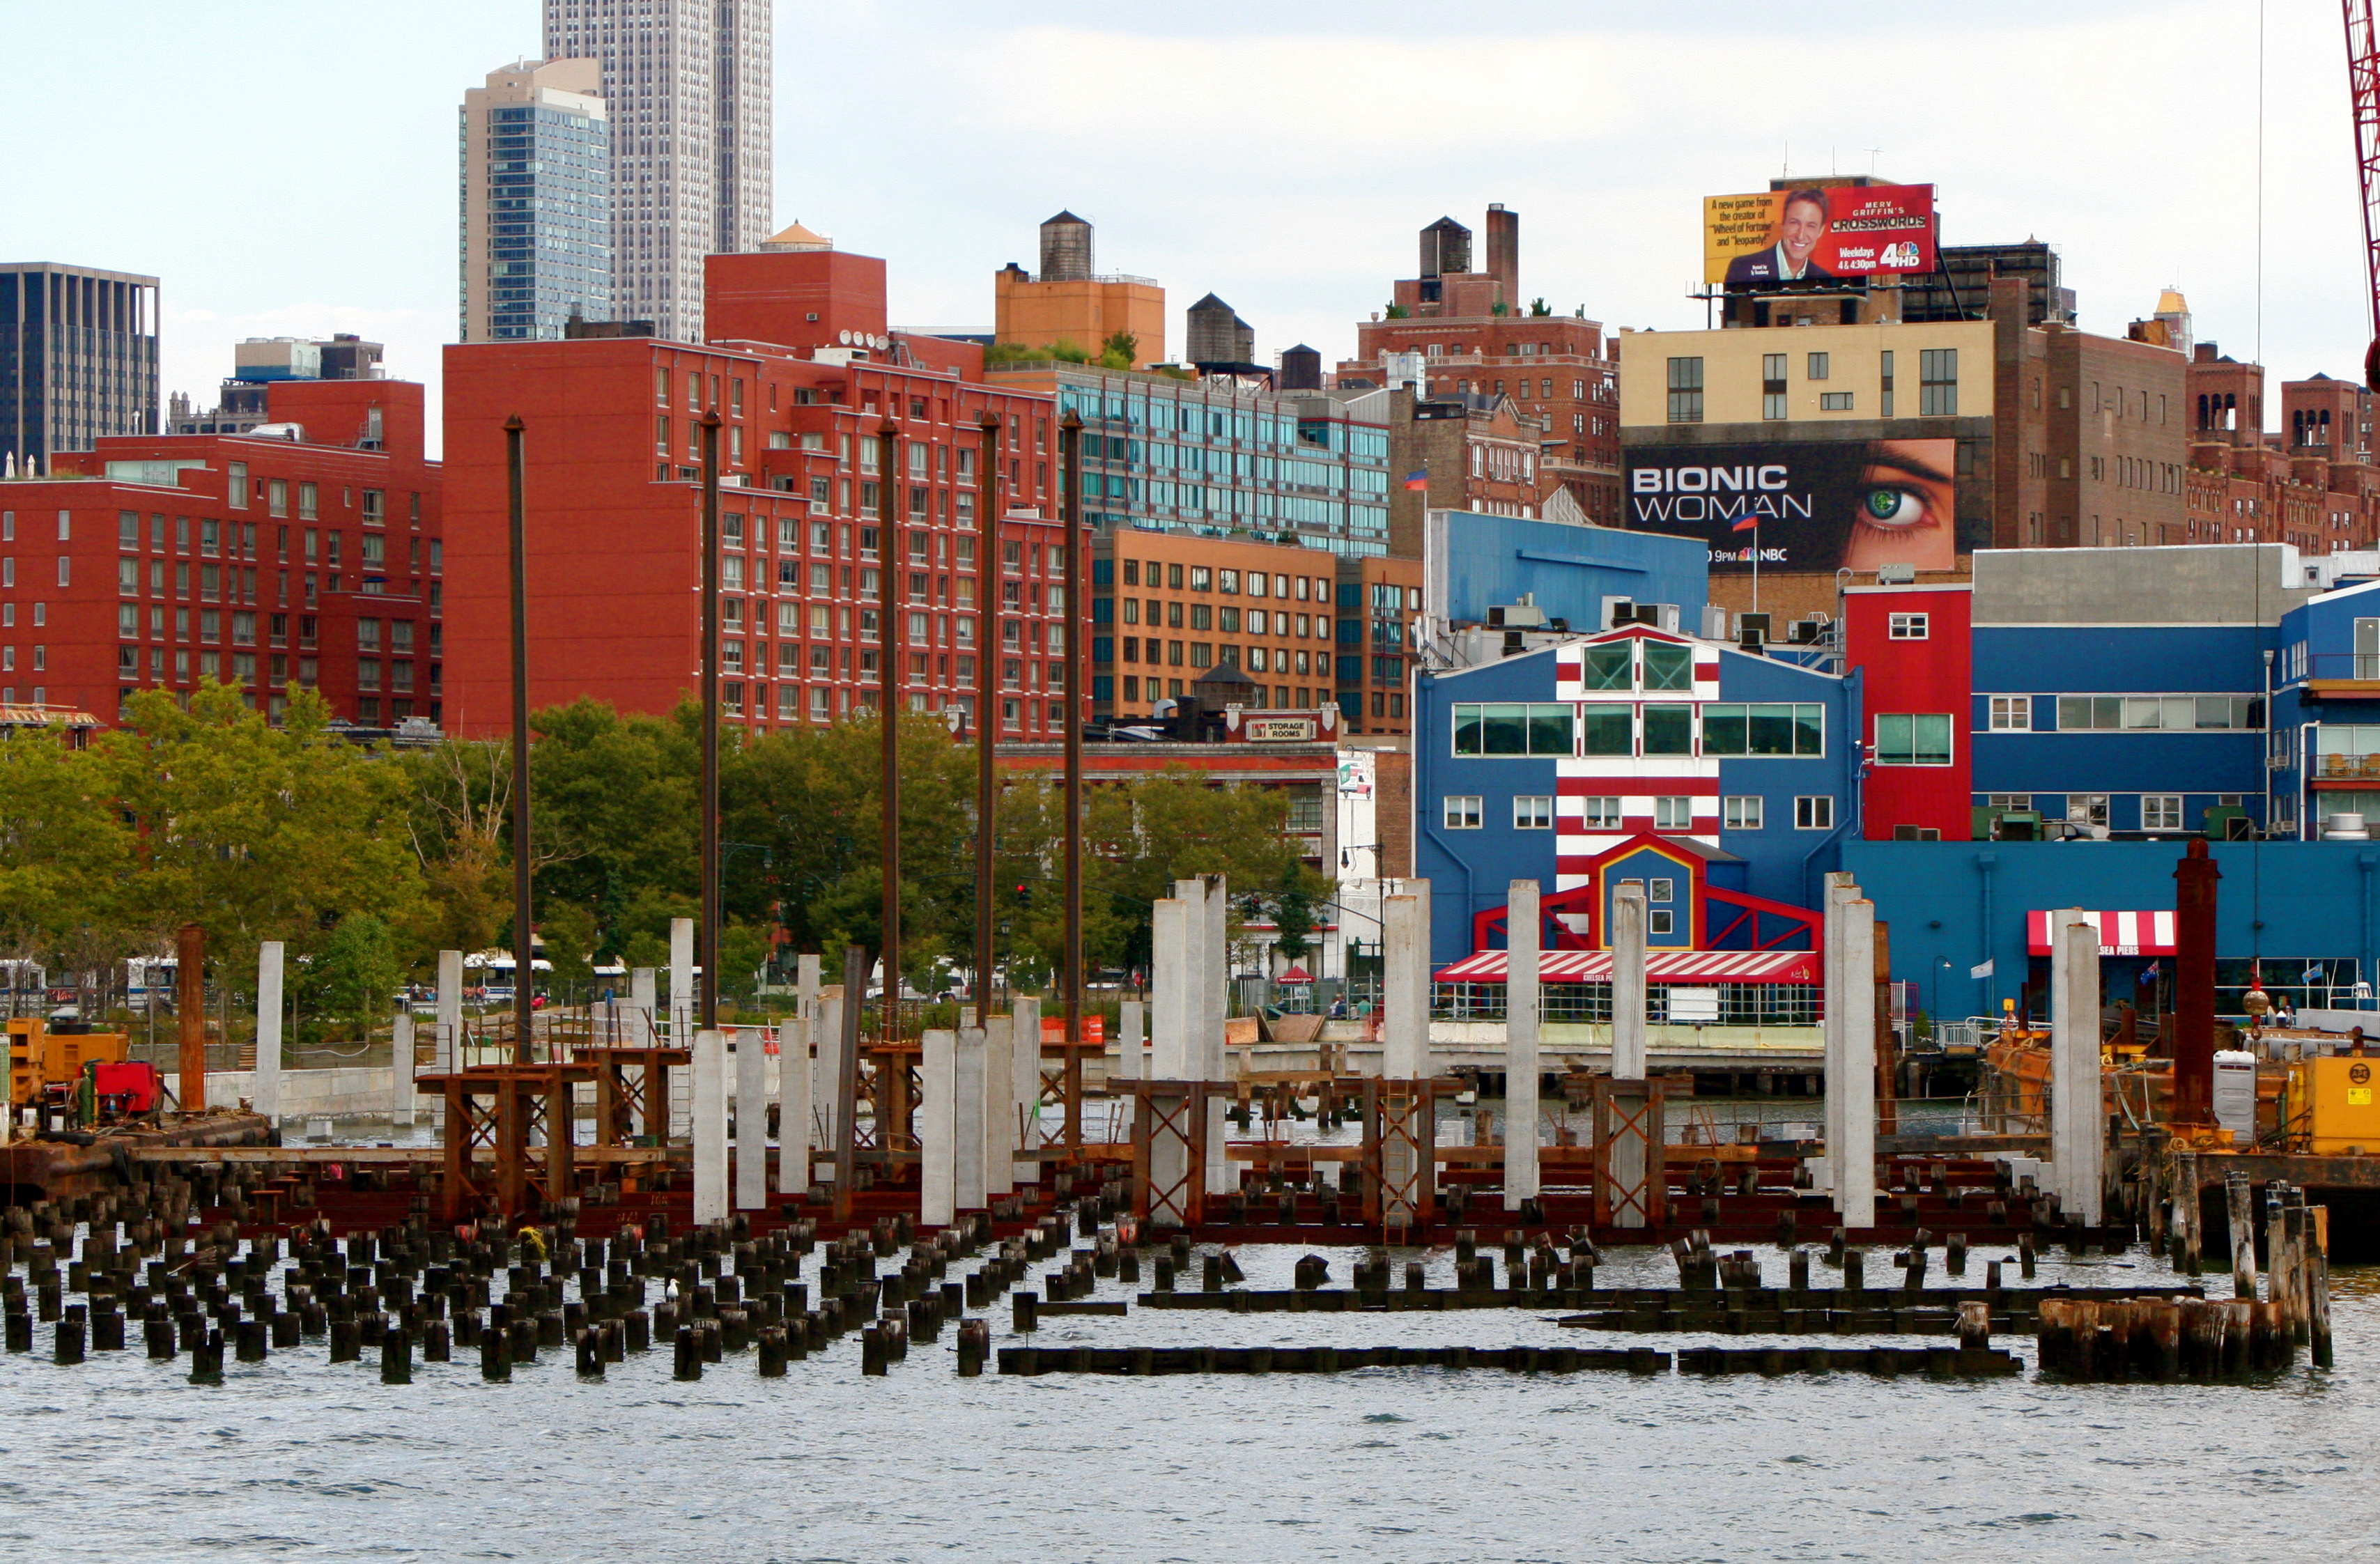
Chelsea Piers Sports Complex
Sports Complex • New York, New York
2345 EXPERT REVIEWS
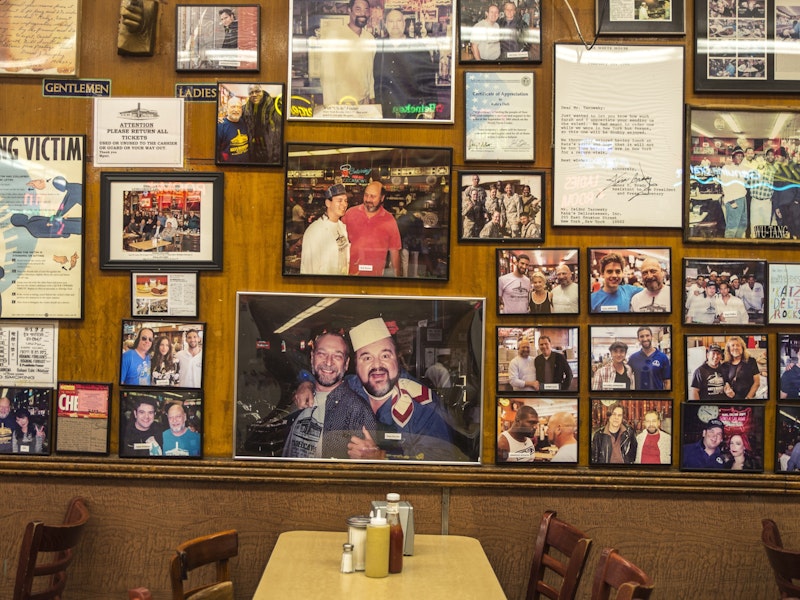
Katz's Delicatessen
Sandwiches, American, Deli, Buildings & Structures • New York, New York
26 EXPERT REVIEWS
ABC Kitchen
New American, Juices & Smoothies • New York, New York
30 EXPERT REVIEWS
Momofuku Ssäm Bar
American, Asian • New York, New York
32 EXPERT REVIEWS
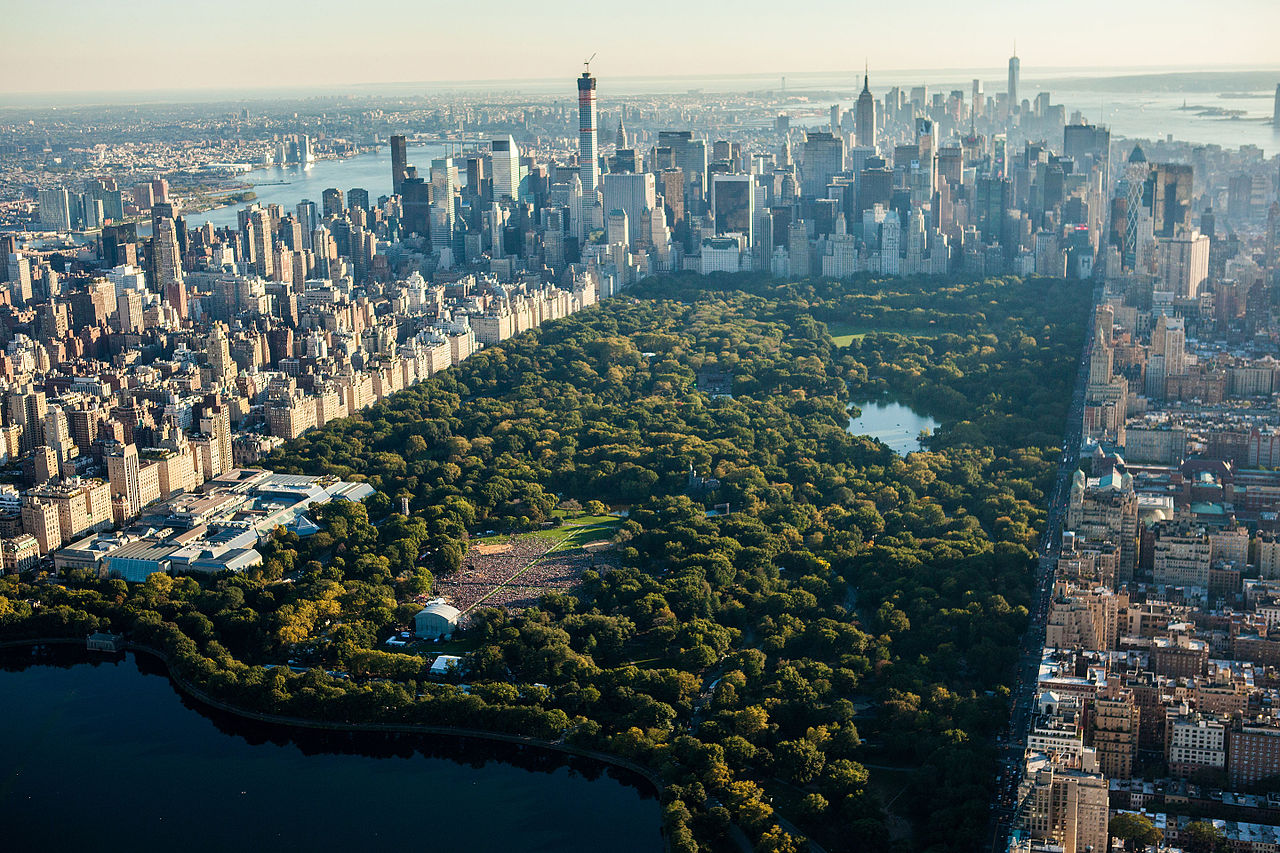
Central Park
Urban Park • New York, New York
2456 EXPERT REVIEWS
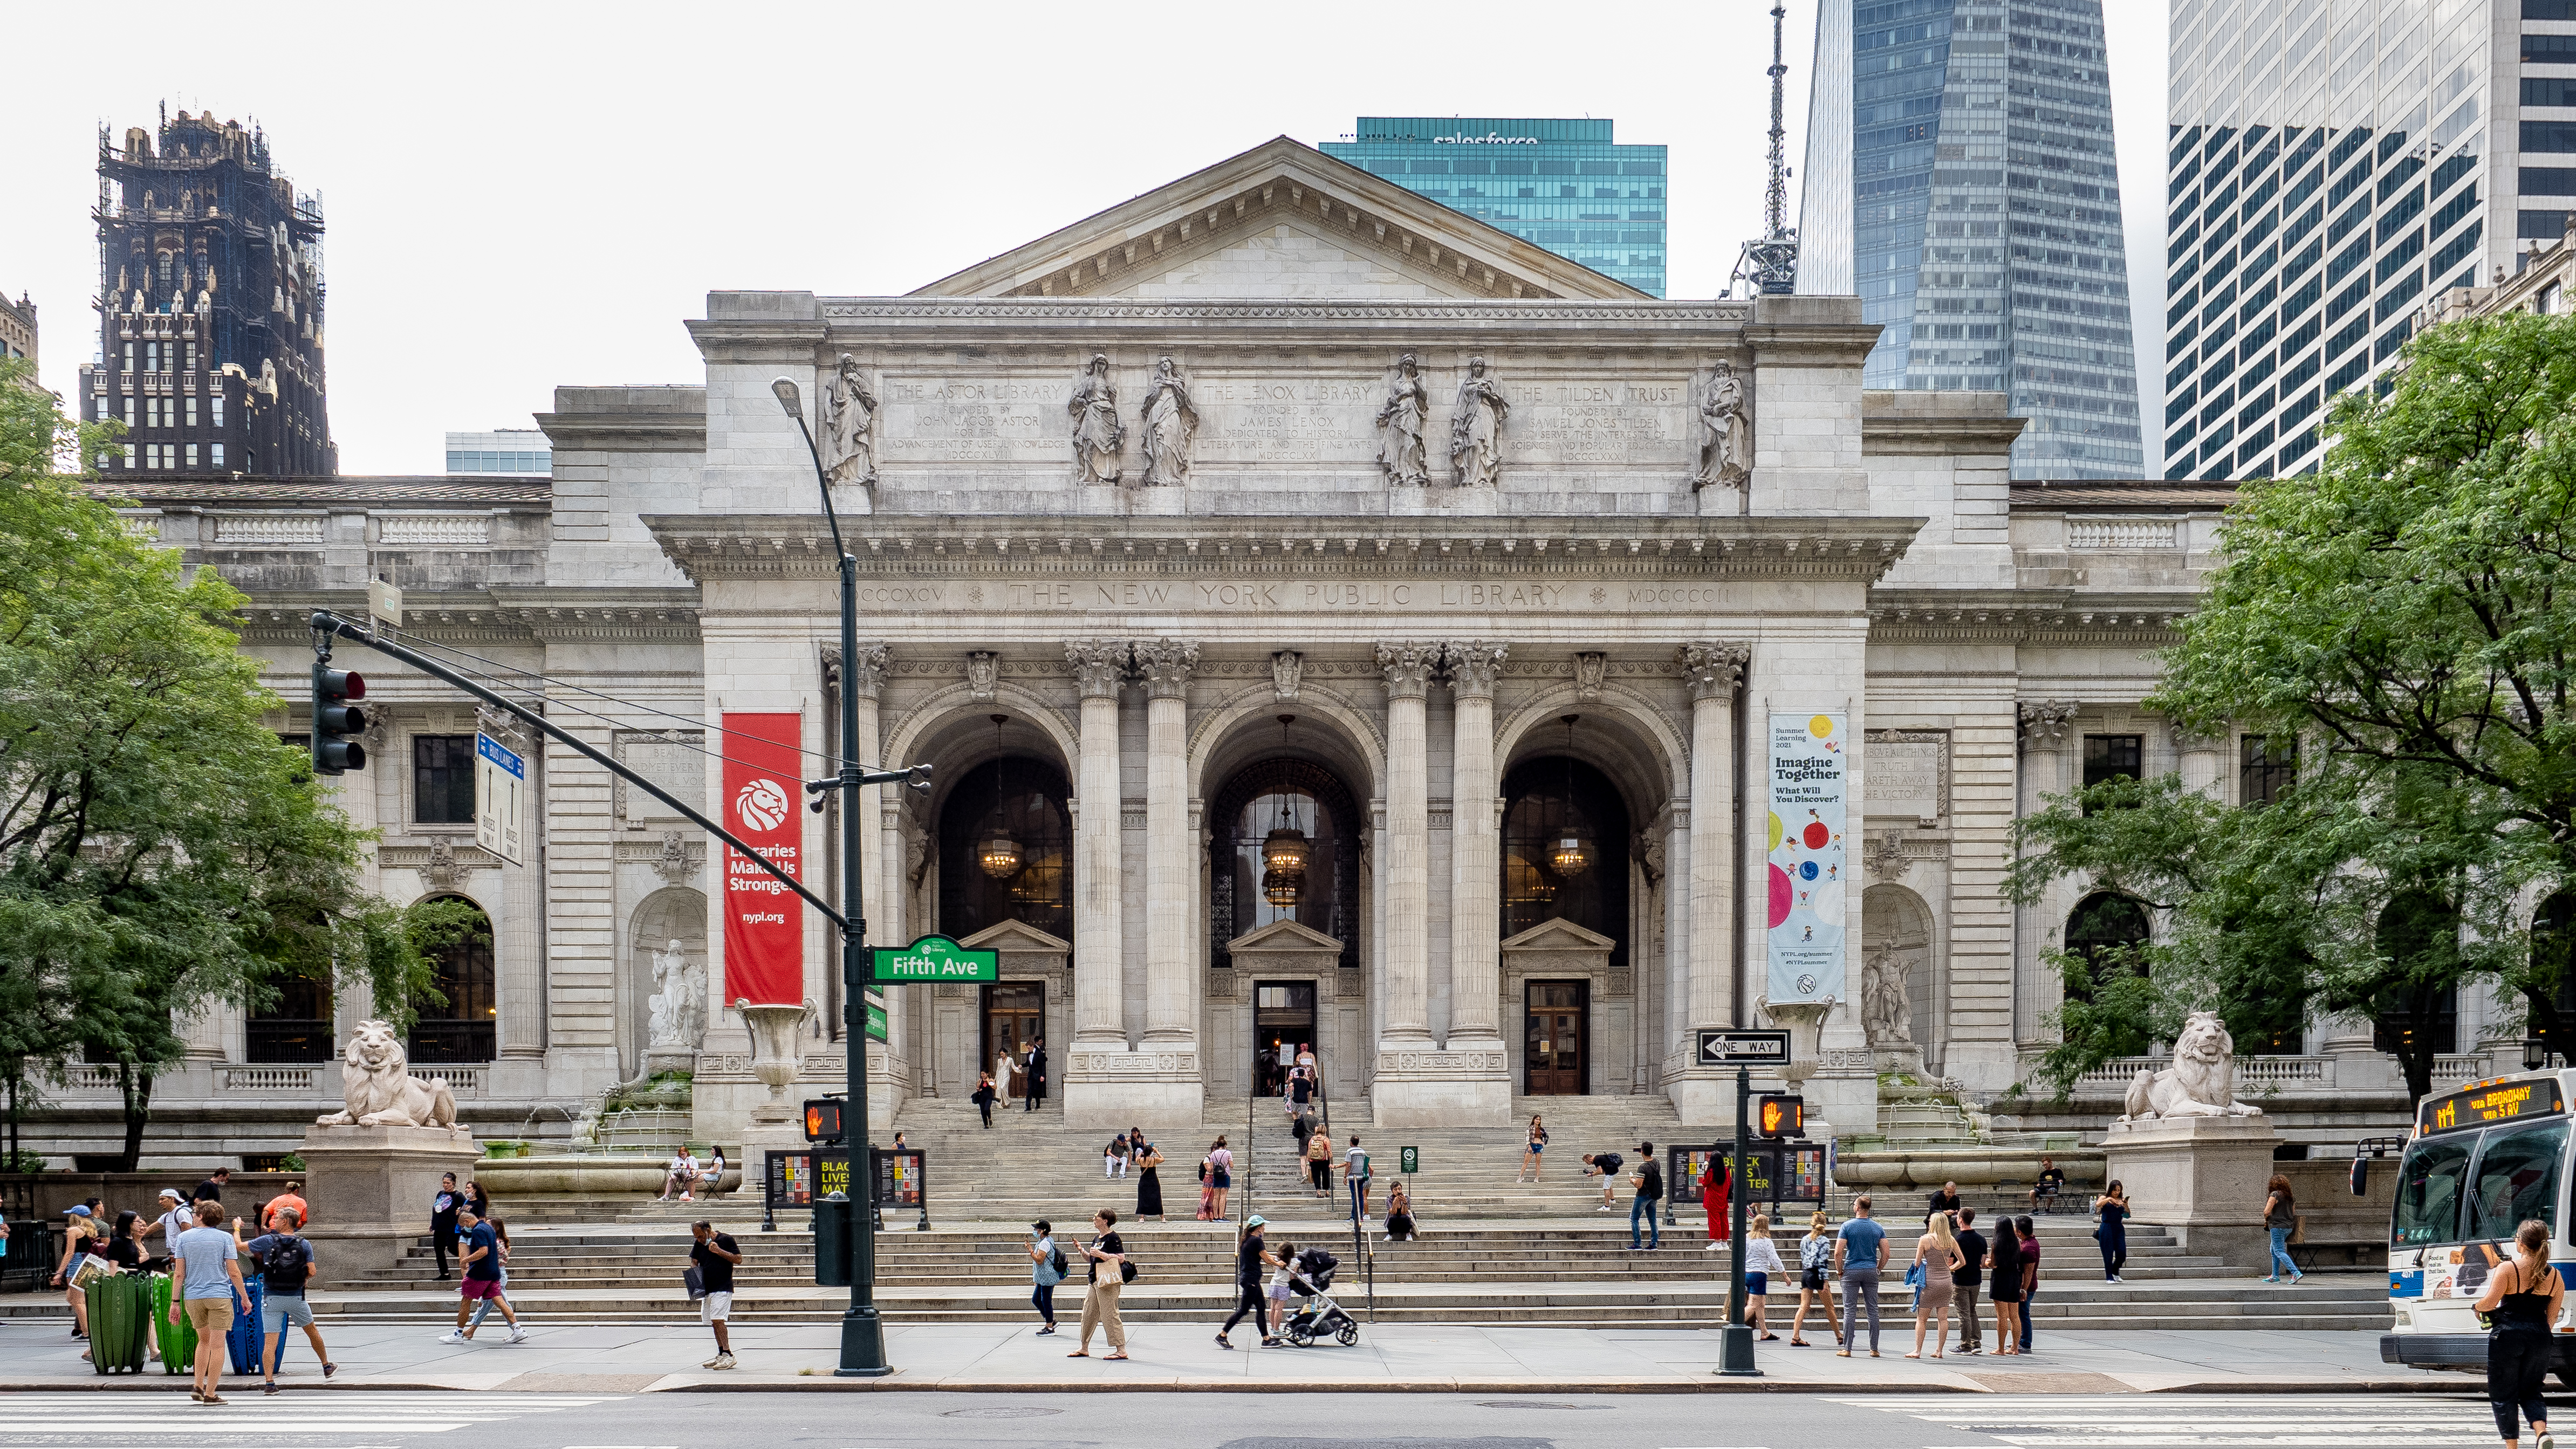
New York Public Library
Library • New York, New York
3456 EXPERT REVIEWS
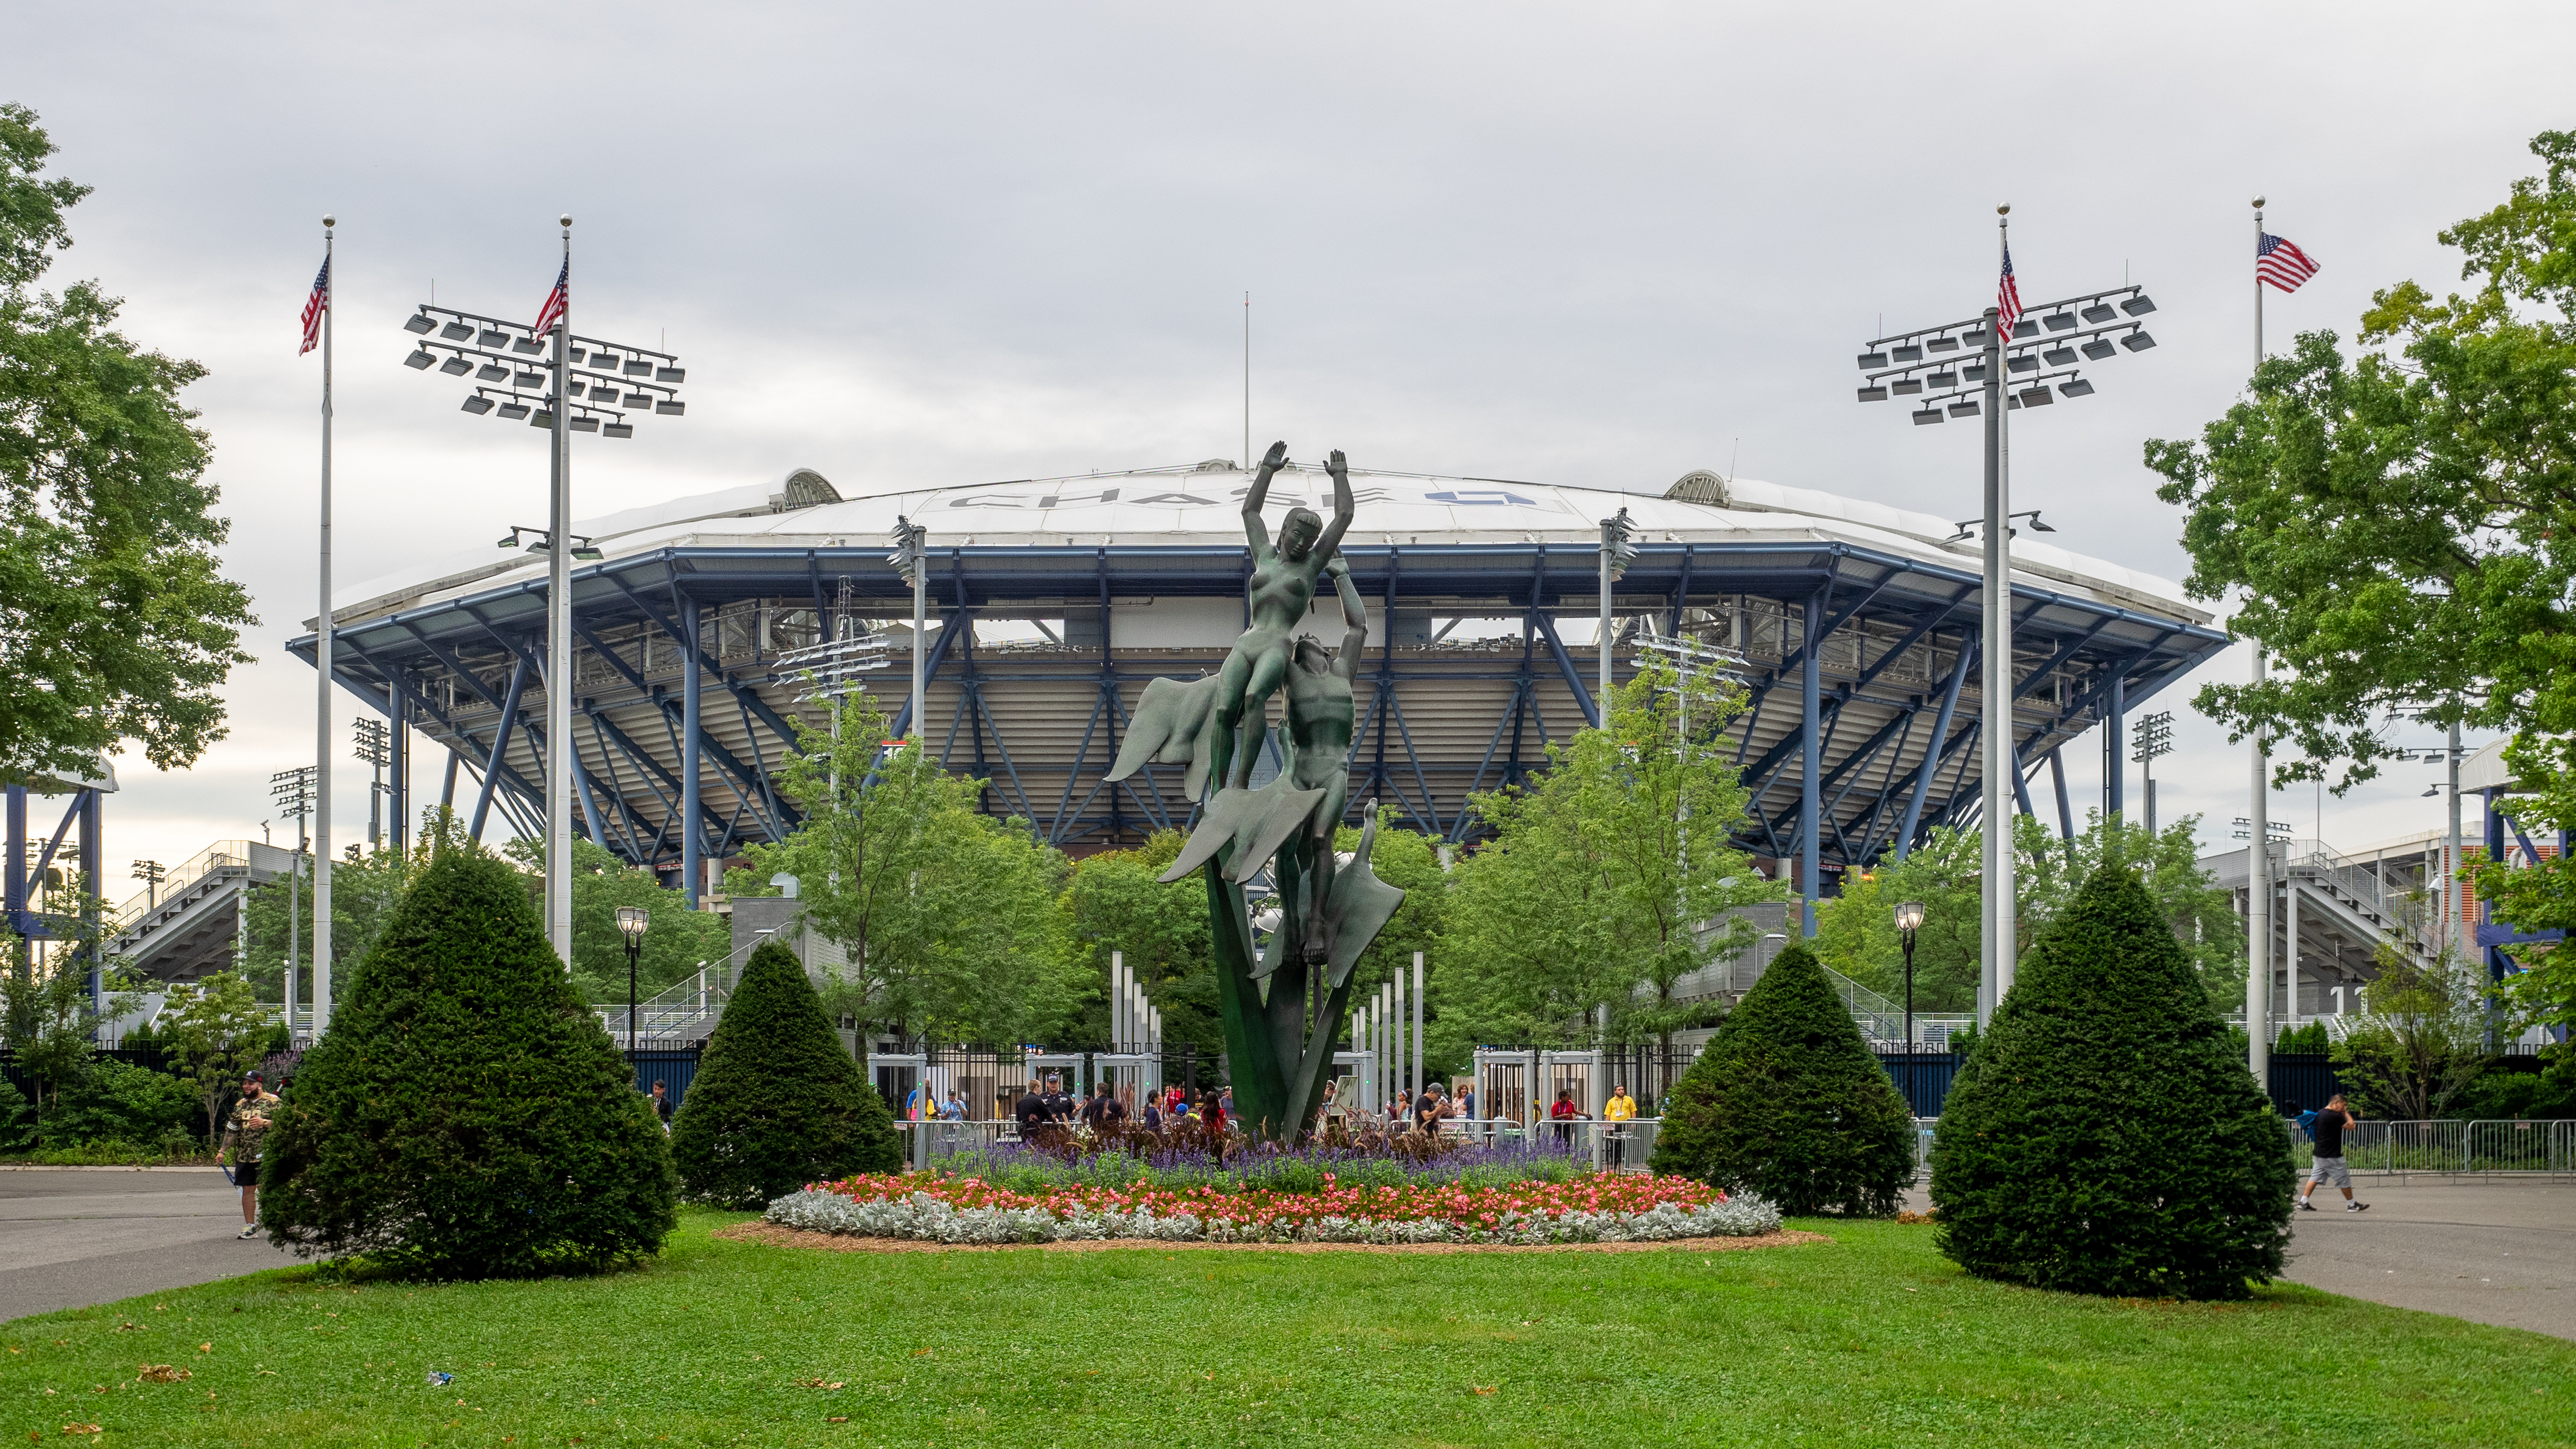
USTA Billie Jean King National Tennis Center
Tennis Center • New York, New York
1876 EXPERT REVIEWS